
MAY 2026 MARKET ANALYSIS FOR CHICAGO'S NORTH SIDE
Our monthly market analysis details six real estate metrics for the Near North Side, Lincoln Park, Lakeview and North Center, followed by our comprehensive monthly summary.
Please let us know if you need information on any of Chicago’s other neighborhoods
APRIL HOME SALES
Year To Date 2026 vs 2025 - Down 15.8%
April 2026 vs 2025 - Down 14.8%
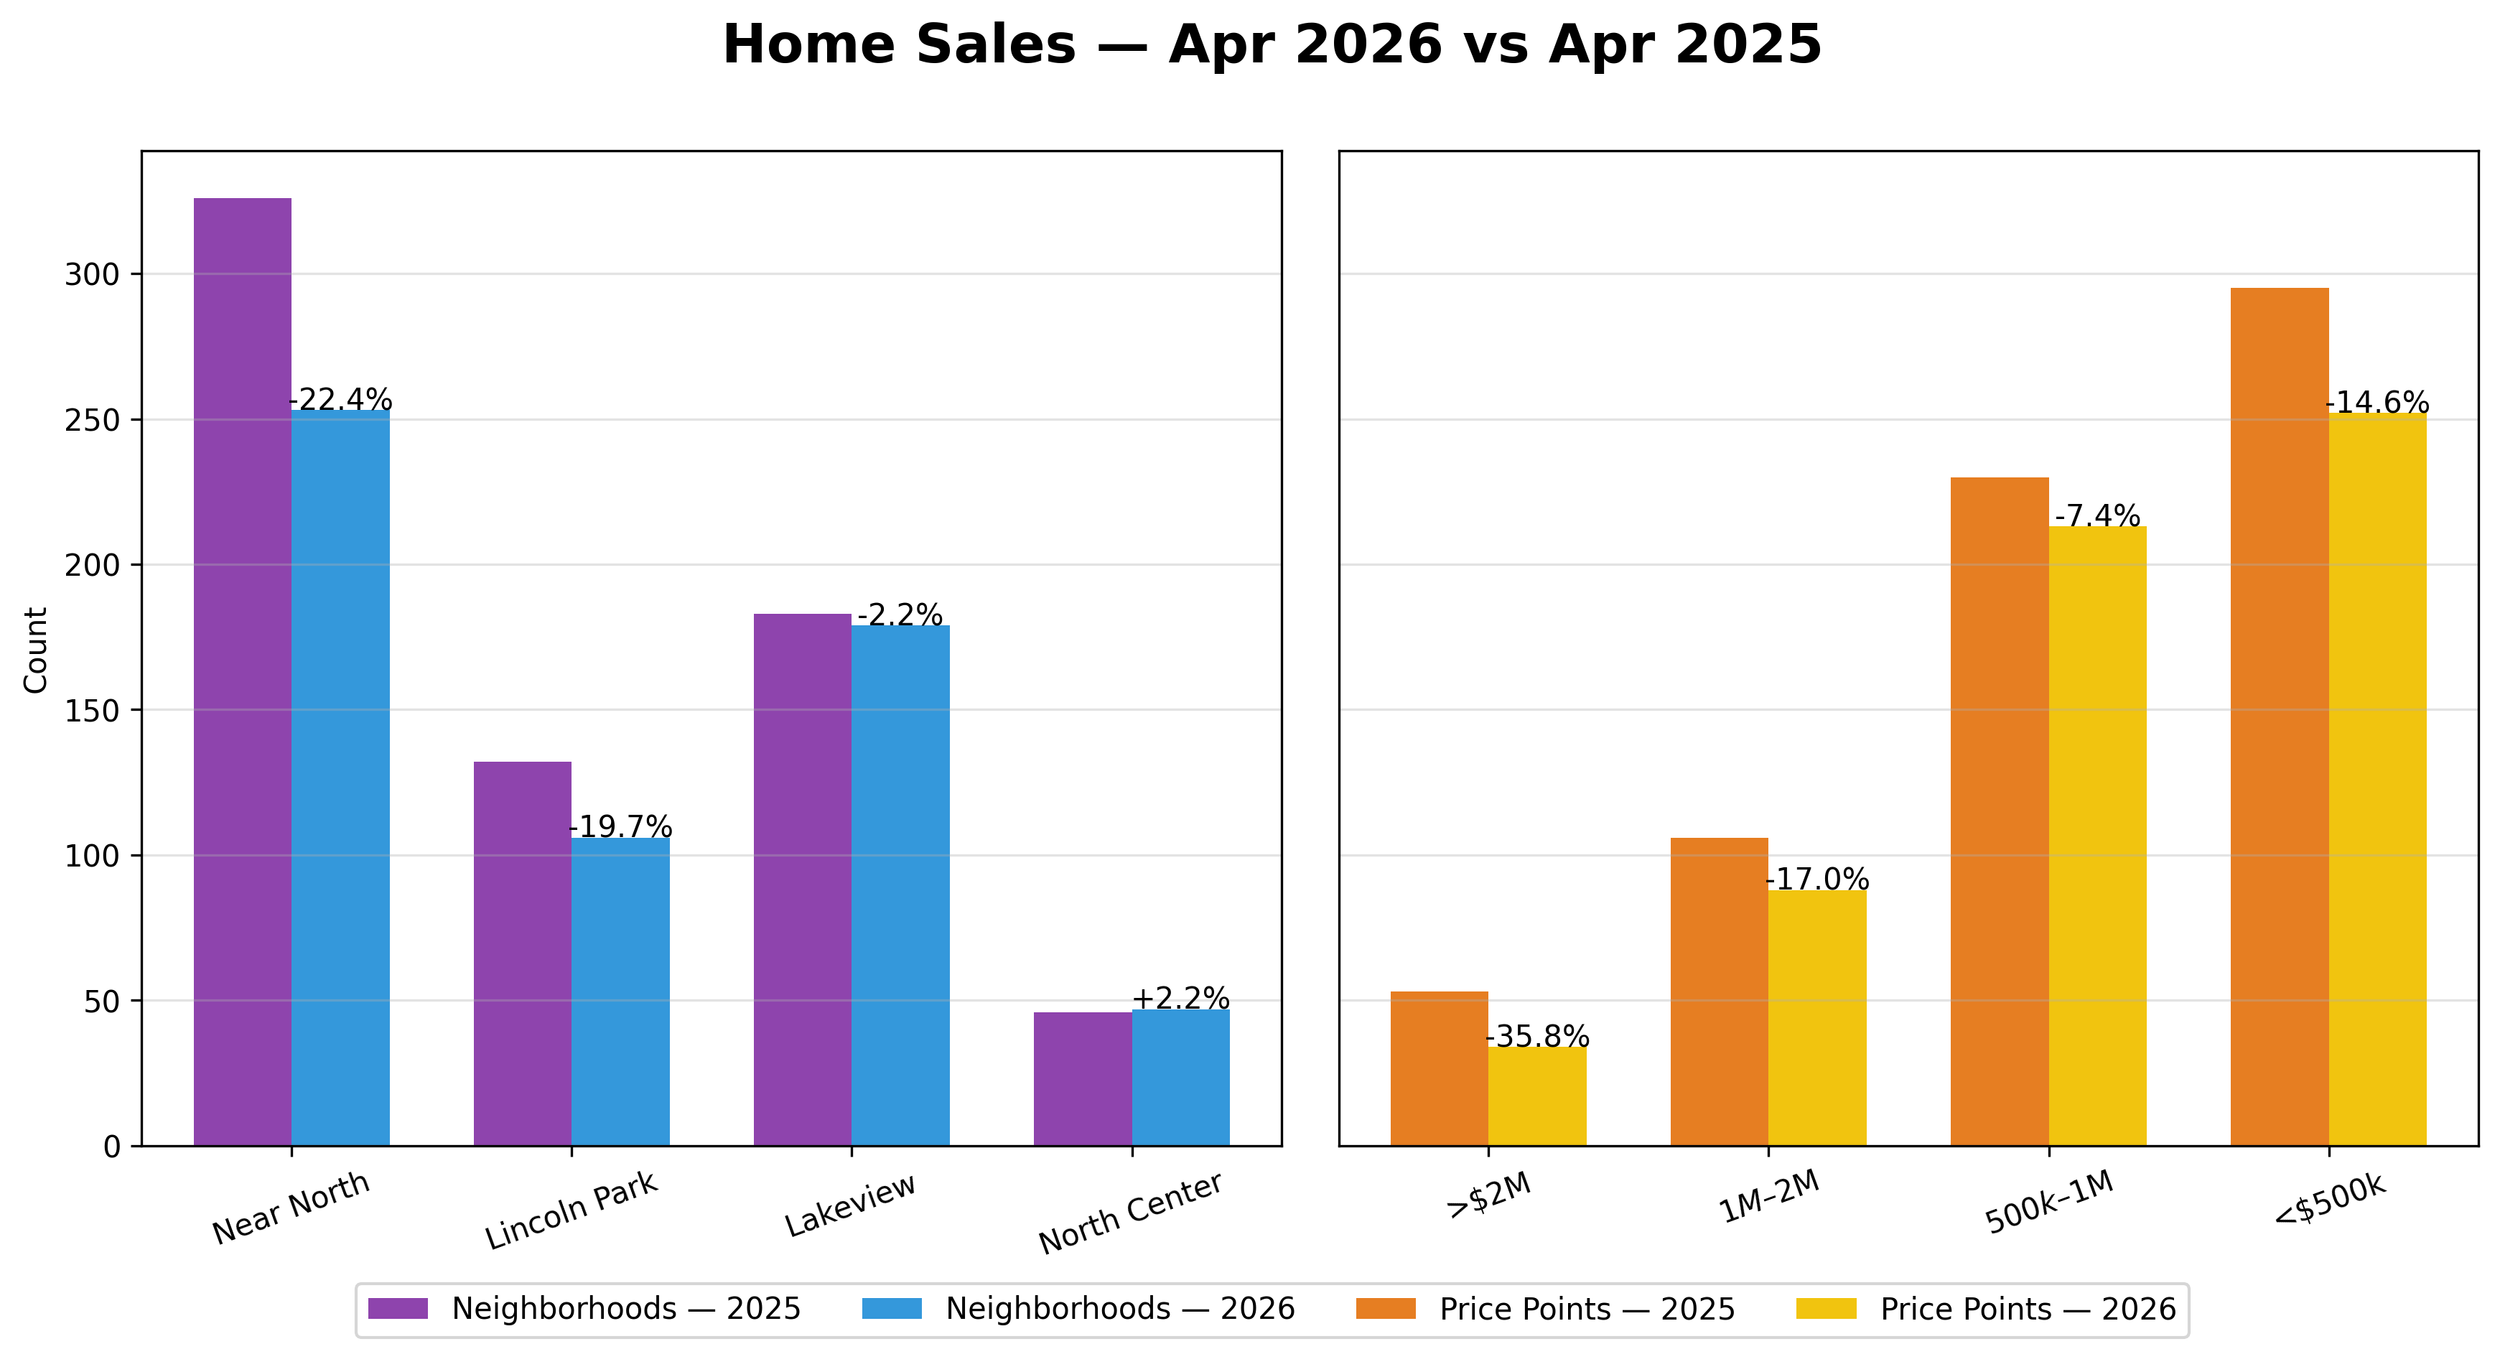
NOTEWORTHY:
Sales declined overall, continuing the trend of moderating activity.
Sales softened across most areas, though Lakeview held steady and North Center showed resilience.
APRIL HOMES UNDER CONTRACT
Year To Date 2026 vs 2025 - Down 11.8%
April 2026 vs 2025 - Down 9.5%
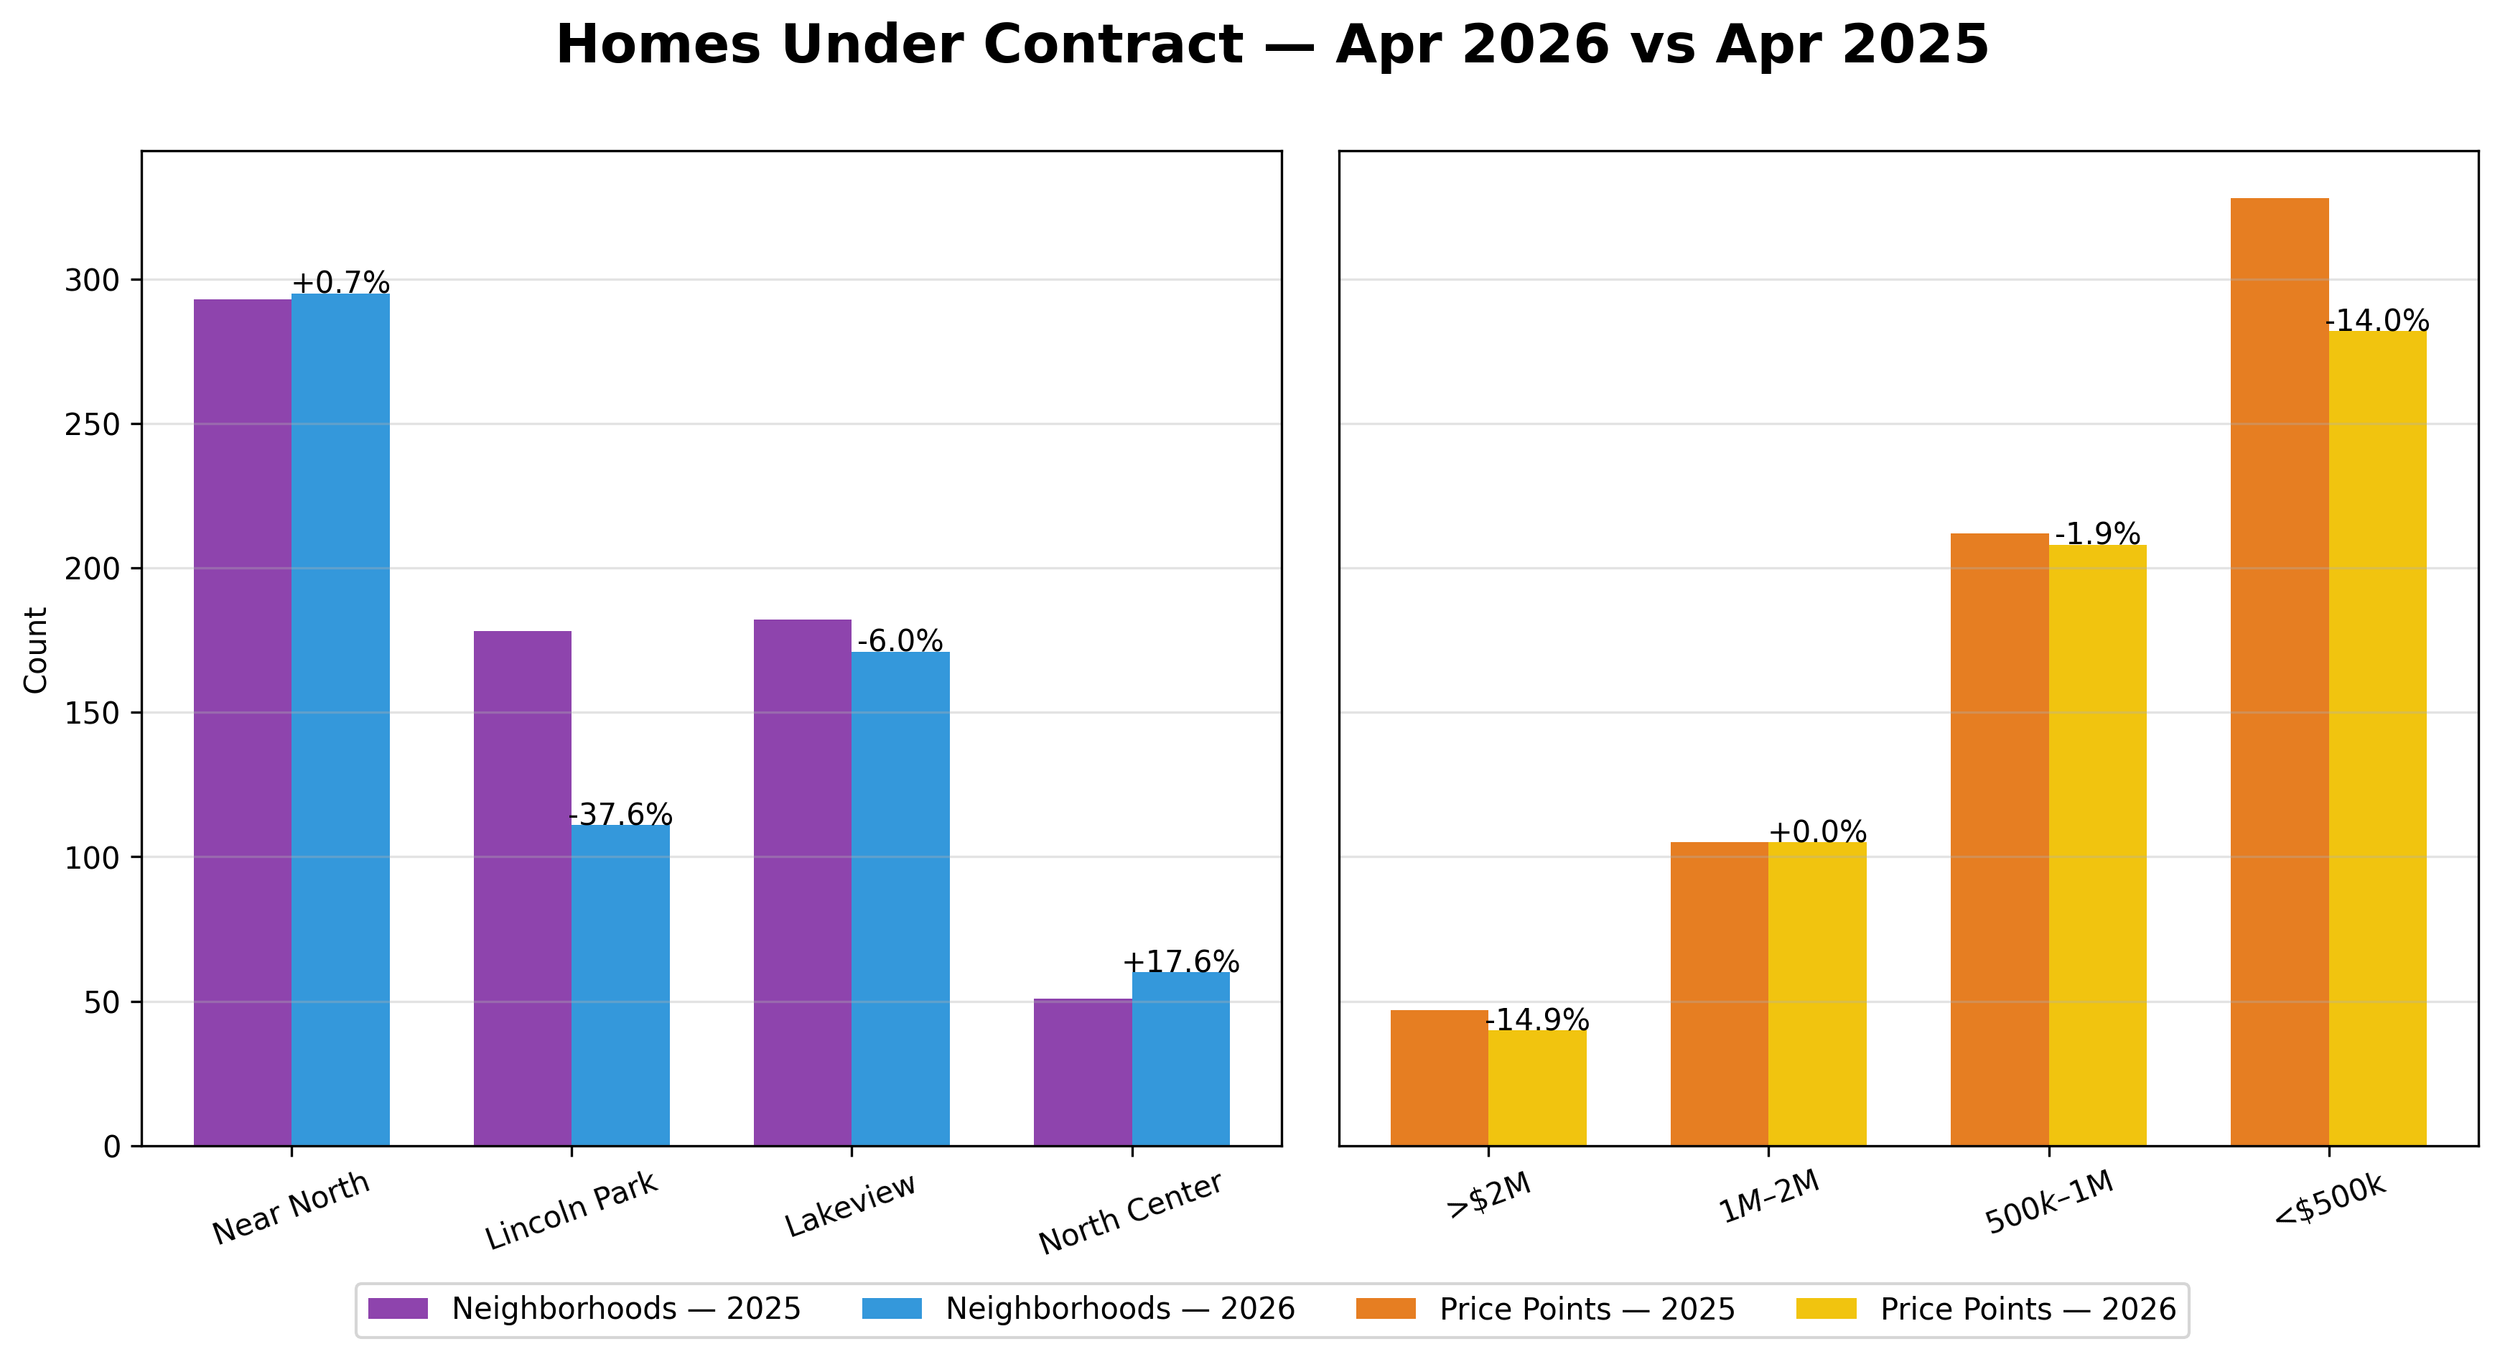
Noteworthy :
Most home sales that closed this month went under contract in a previous month. Units Under Contract reflects a more accurate picture of the current month, although not every home that goes under contract closes.
In April, pending activity showed mixed performance
Demand remains uneven, with strength in North Center offsetting significant declines in Lincoln Park.
APRIL HOMES FOR SALE
Year To Date 2026 vs 2025 - Down 31.5%
April 2026 vs 2025 - Down 34.6%
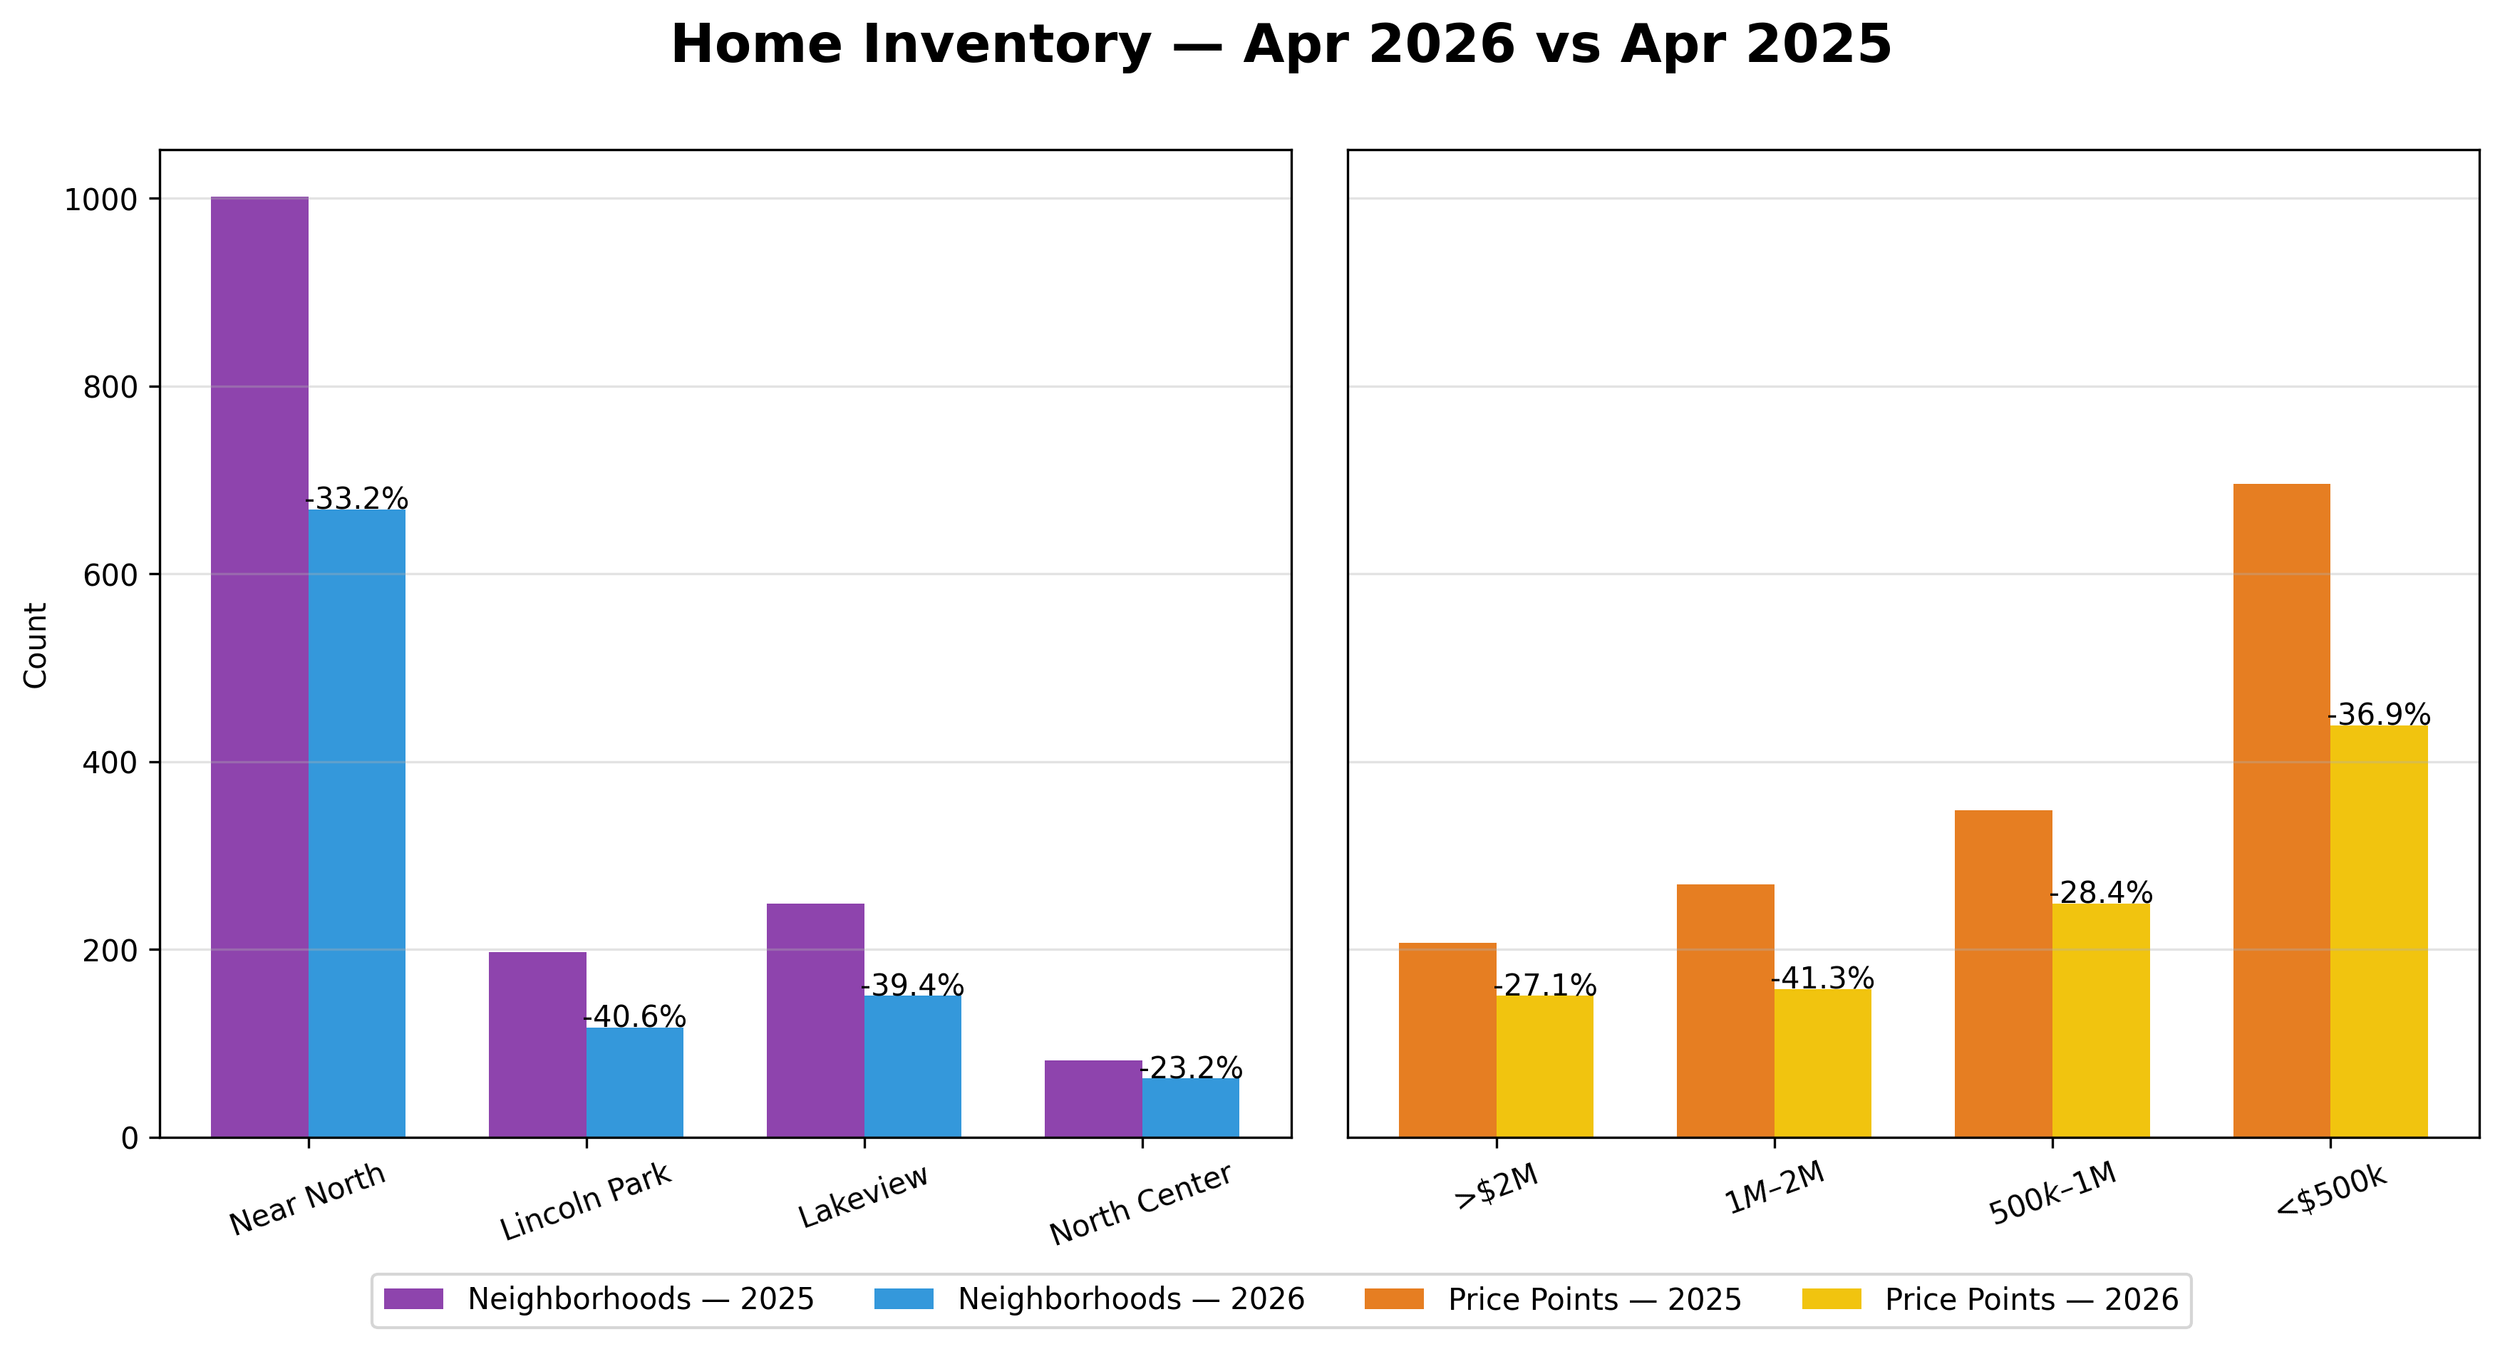
Noteworthy:
Inventory continues to contract sharply.
Supply constraints remain severe across all neighborhoods, especially in Lincoln Park and Lakeview
APRIL MONTHS OF SUPPLY OF INVENTORY
Year To Date 2026 vs 2025 - Down 27.2% to 1.6 MSI
April 2026 vs 2025 - Down 29.1% to 1.7 MSI
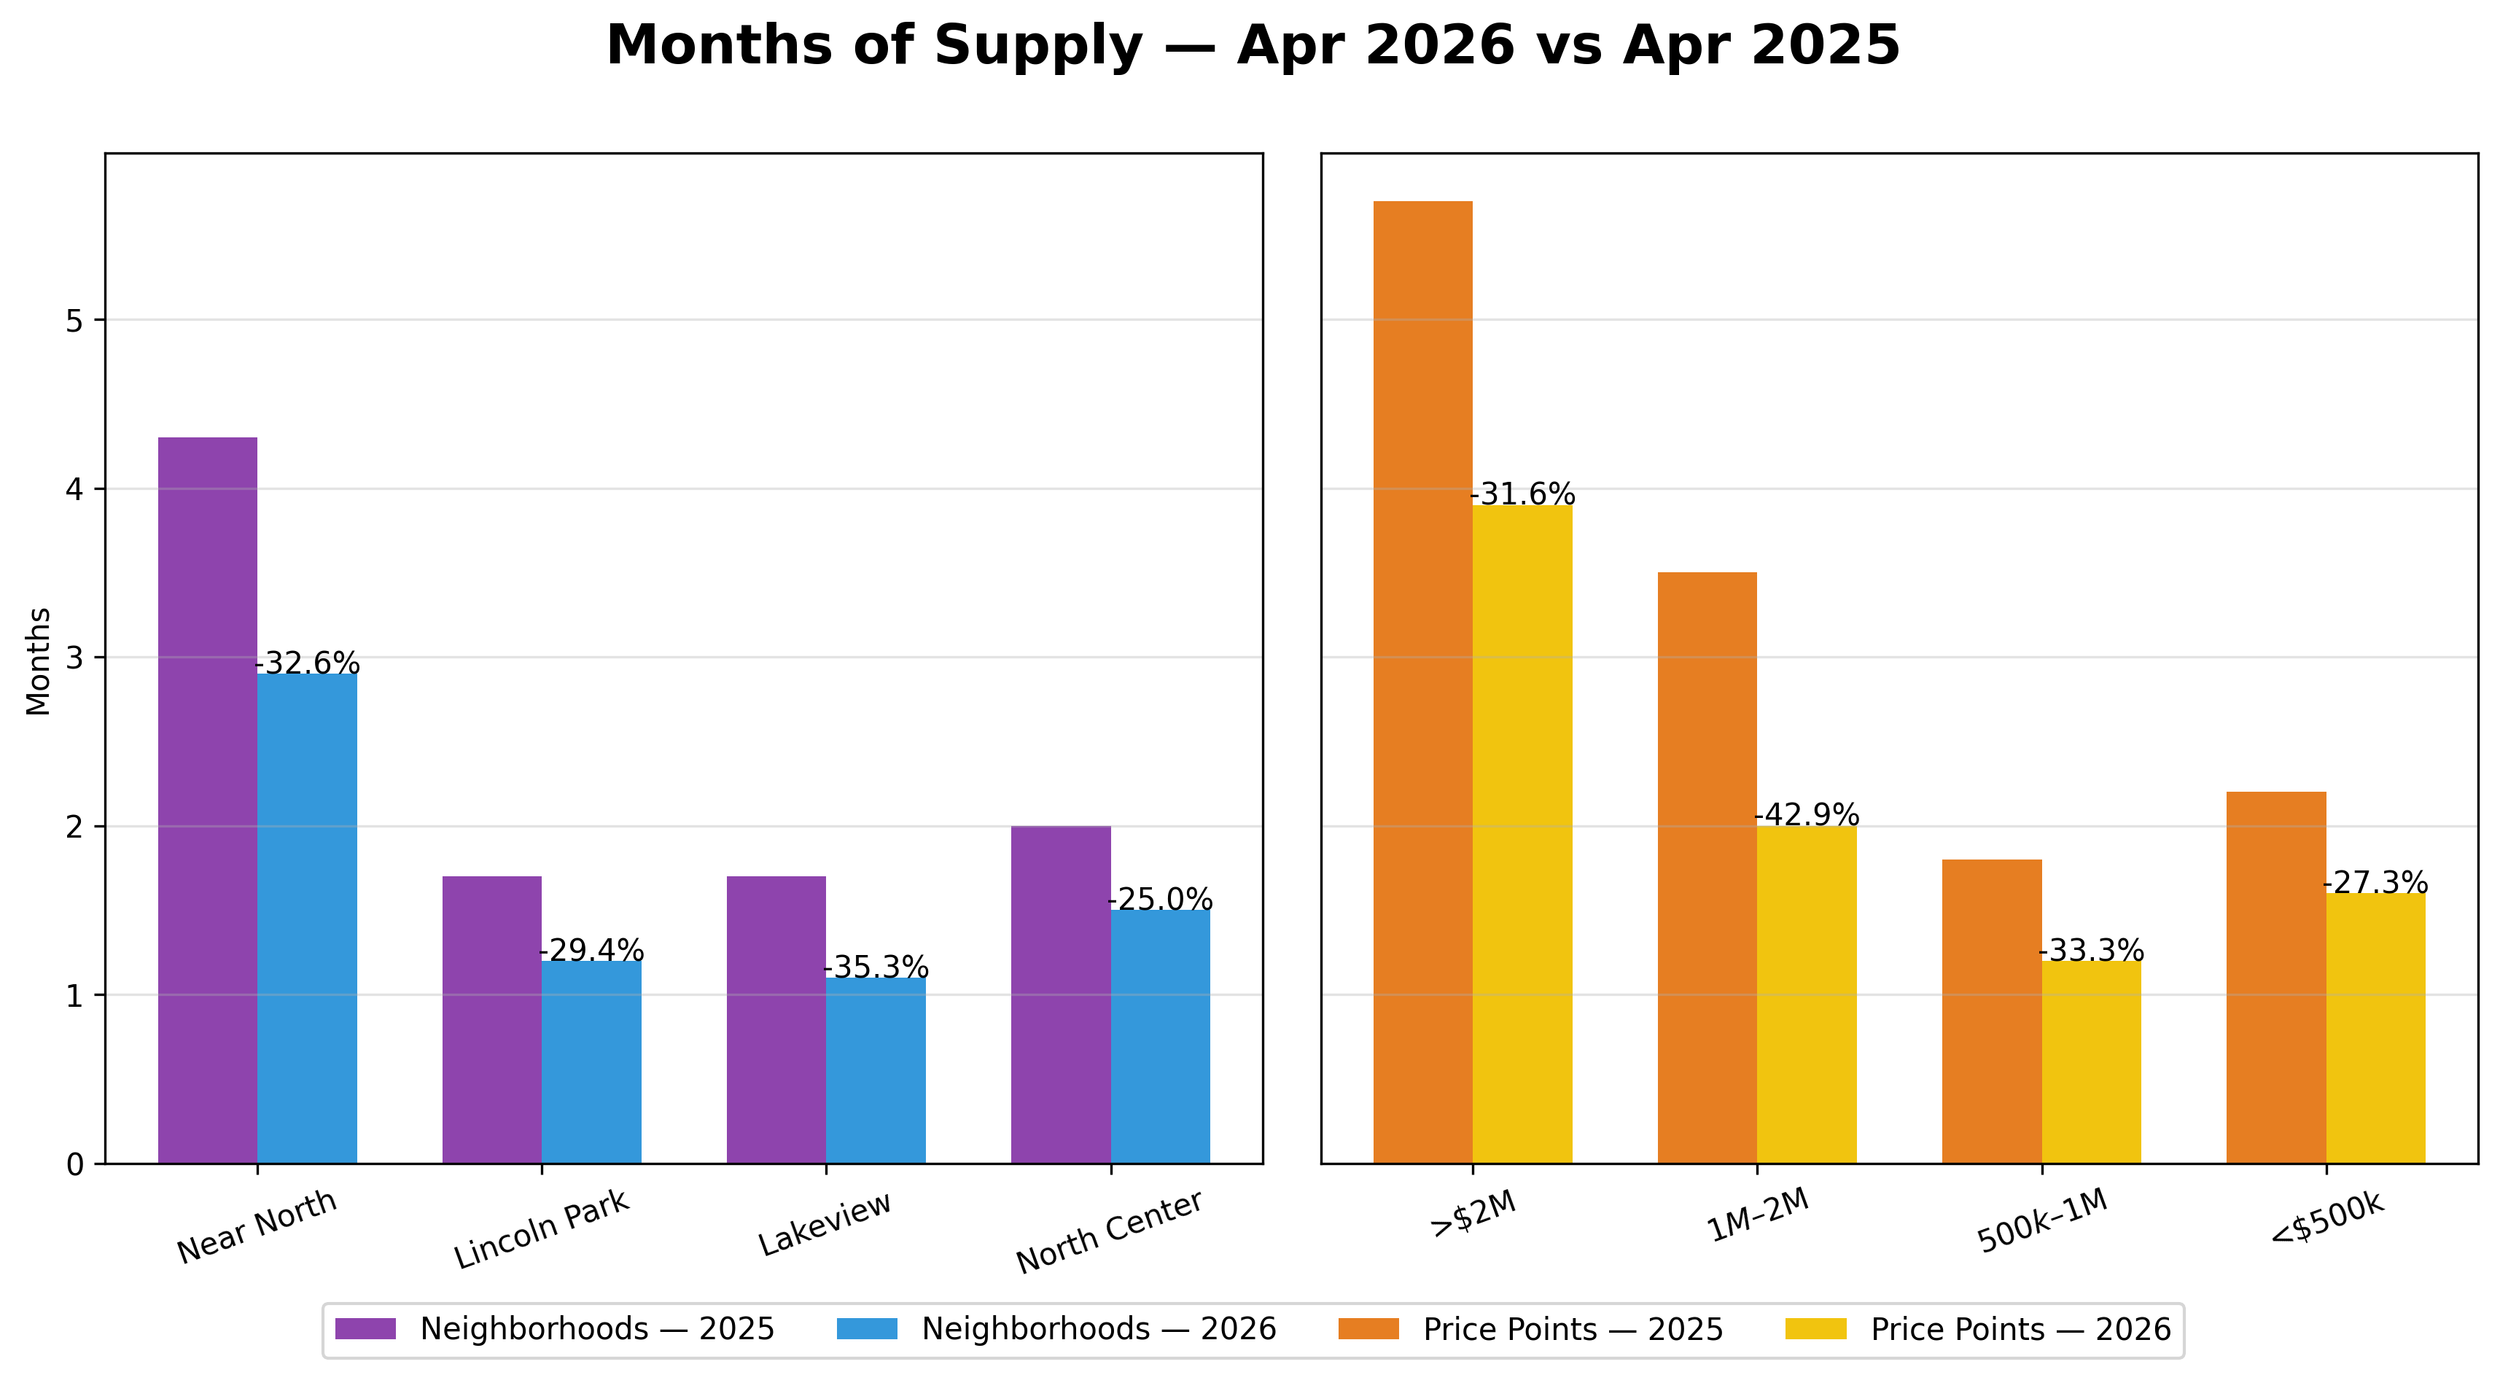
Noteworthy :
Supply tightened further as inventory declines outpaced sales.
The market remains firmly supply-constrained, limiting available options for buyers.
APRIL MEDIAN PRICING
Year To Date 2026 vs 2025 - Up 4.3%%
April 2026 vs 2025 - Up 4.9%
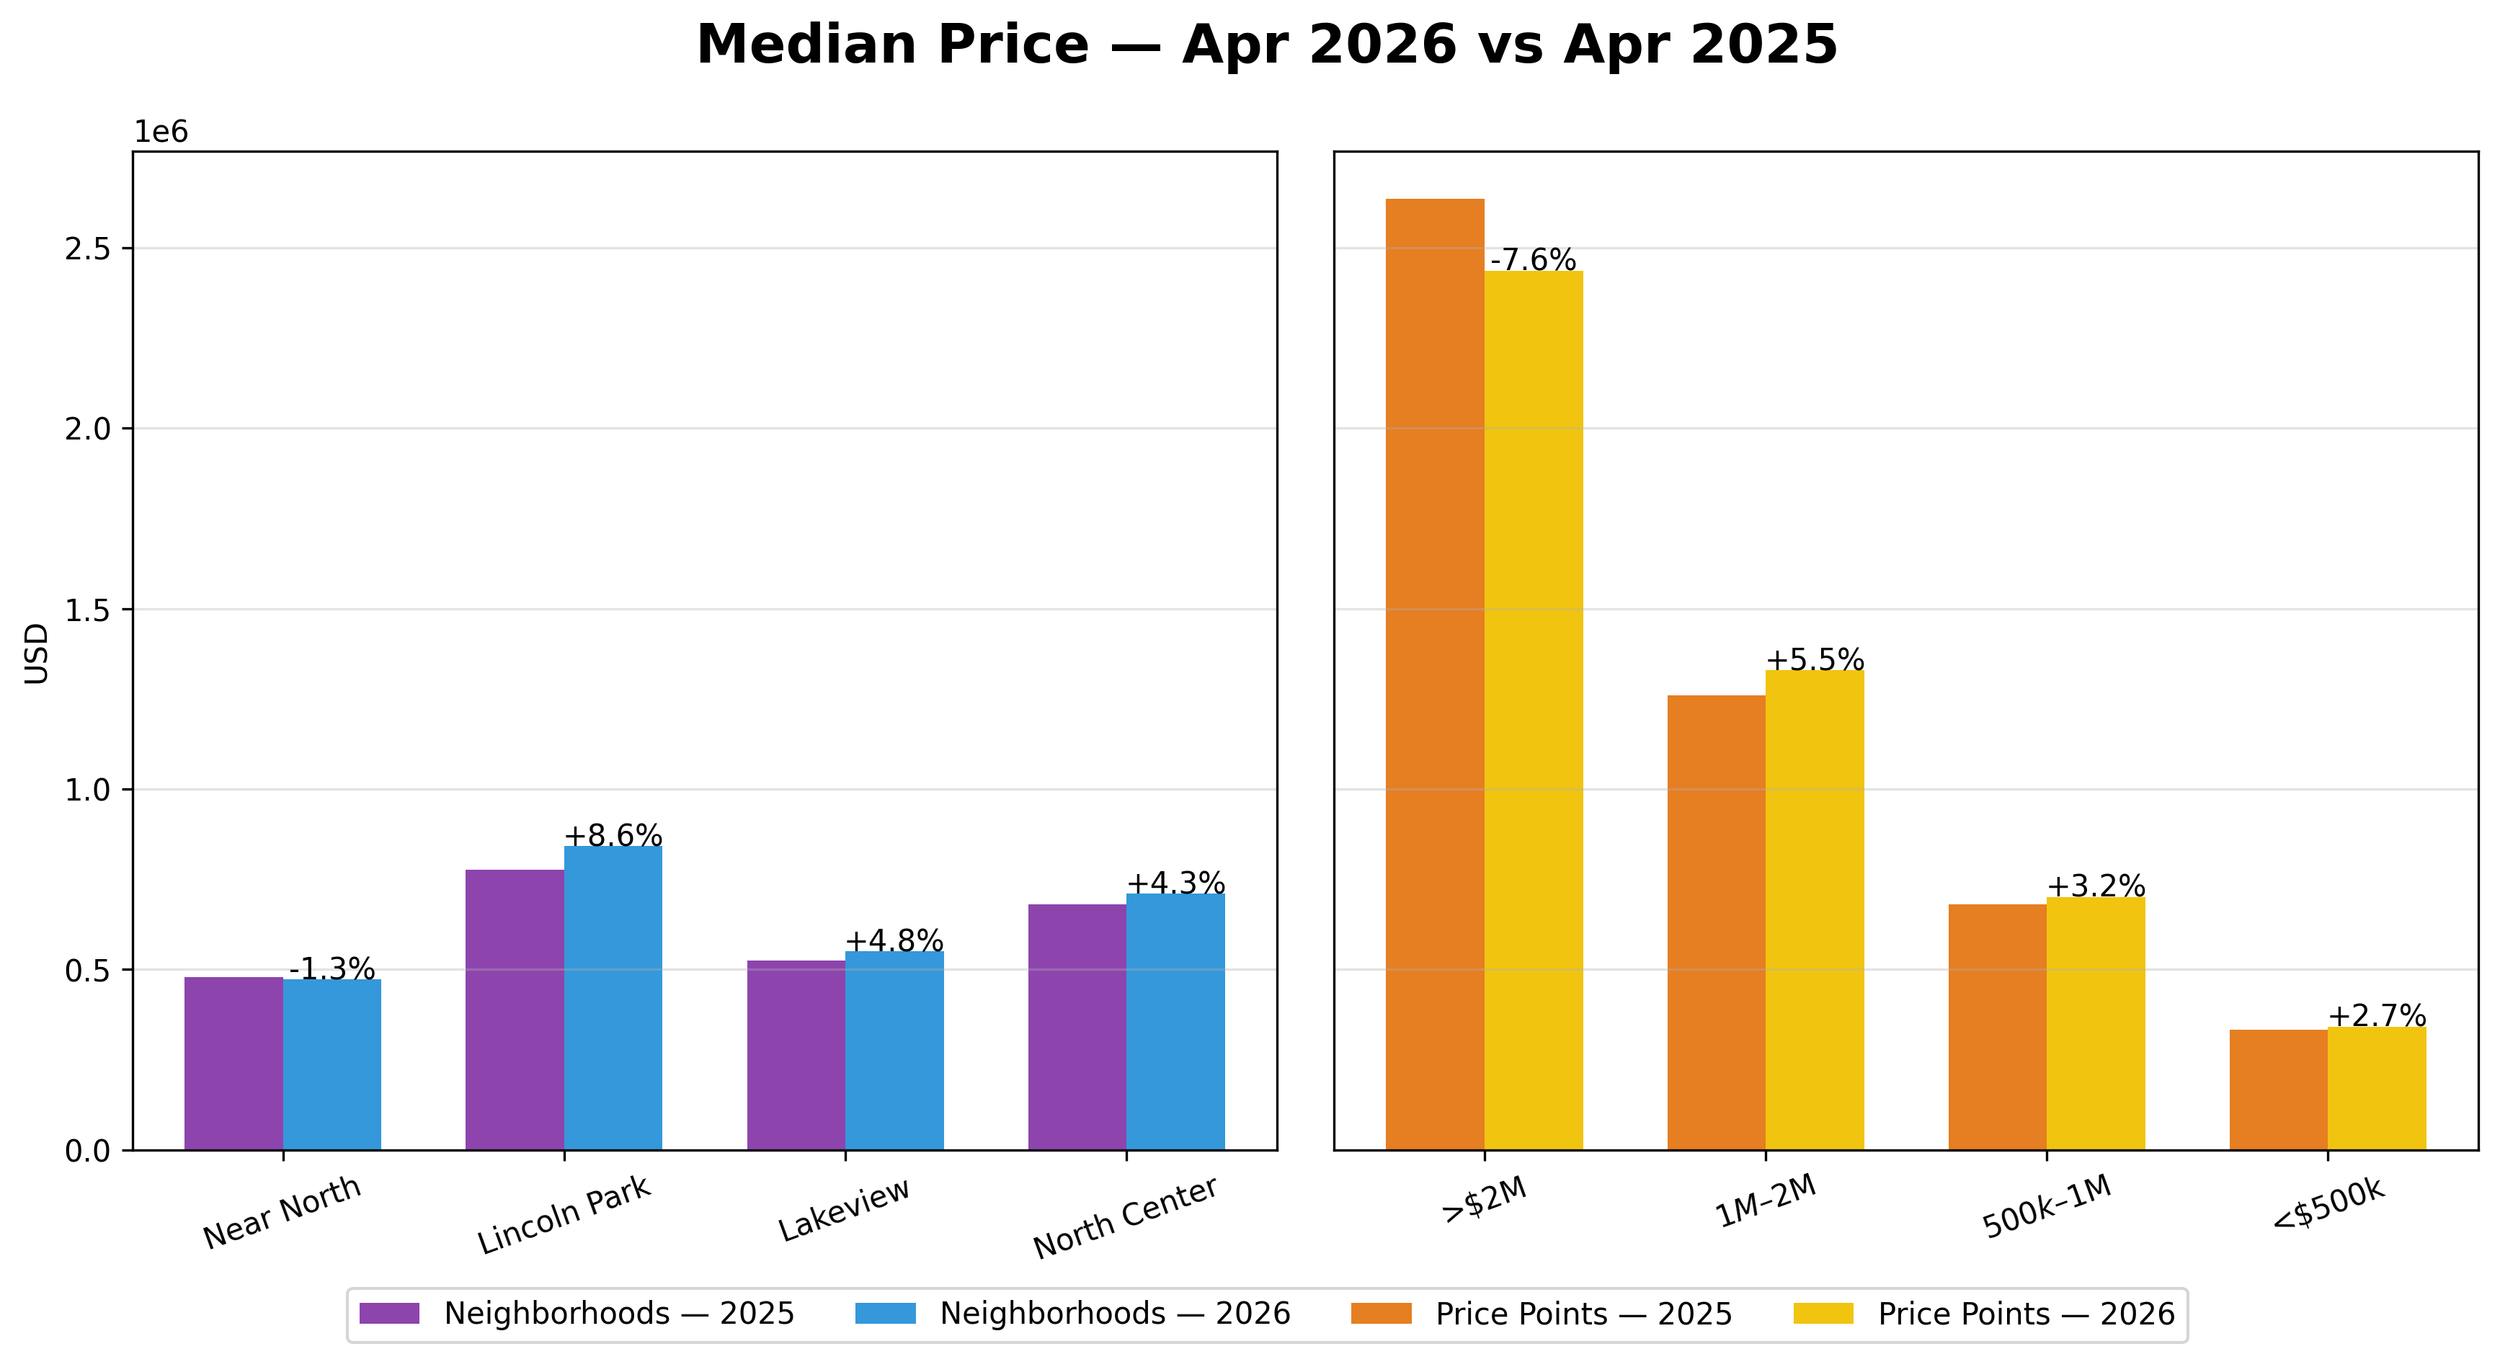
Noteworthy :
Pricing trends were mixed but generally stable to positive.
Prices remain supported by low inventory, with strong gains in Lincoln Park offsetting slight softness in Near North.
APRIL NEW LISTINGS
Year To Date 2026 vs 2025- Down 20.5%
April 2026 vs 2025 - Down 20.9%
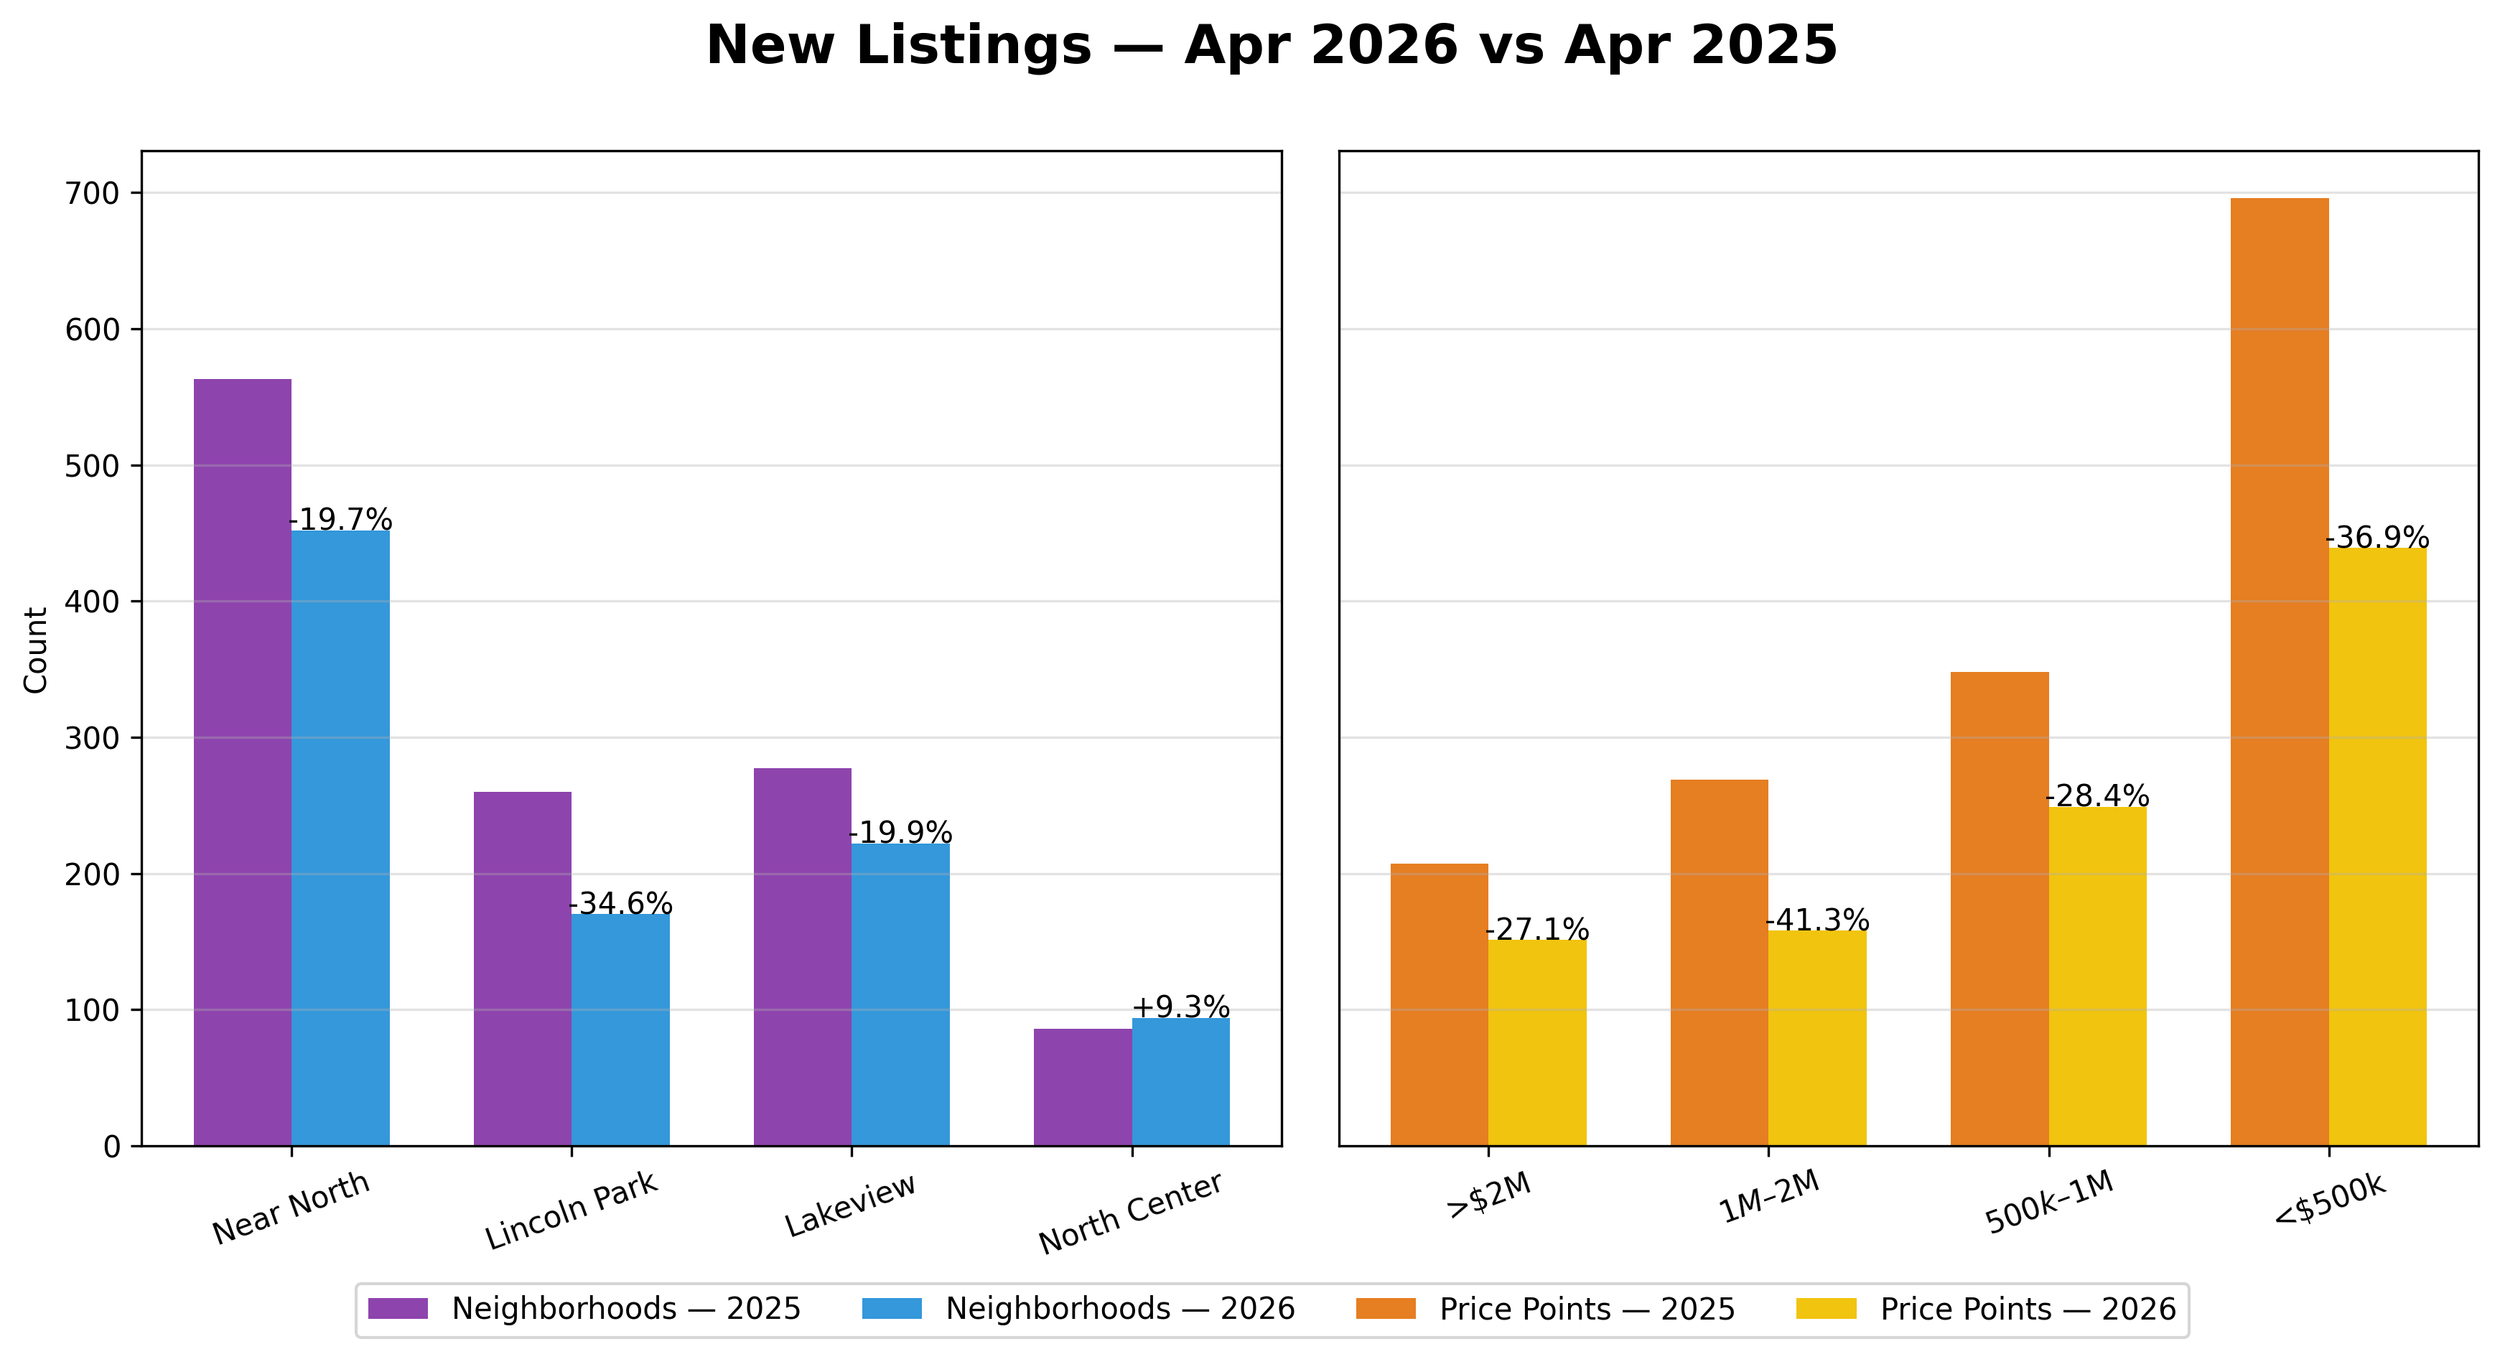
Noteworthy :
New listing activity declined significantly.
Fewer new listings continue to constrain supply, particularly in Lincoln Park.
APRIL SUMMARY
The March housing market reflects a continued imbalance between supply and demand, characterized by:
🔻 Slowing Activity
Sales and contracts declined across most segments
Mid-market and Lincoln Park saw the largest pullbacks
🔻 Severe Supply Constraints
Inventory down over 30%+ across all segments
New listings remain significantly below prior year
🔺 Pricing Resilience
Median prices increased despite lower sales
Strength driven by North Center and constrained inventory
Key Takeaways
April reinforces a supply-driven market:
Even as demand moderates, the sharper decline in inventory and new listings is keeping the market tight, supporting prices and limiting transaction volume.
Going Forward
The single most positive aspect of this market is that there is an abundance of buyers who want to buy and live in our neighborhoods.
Buyers seemed to have acclimated to current interest rates and rising home prices.
YOUR HOME
A logical question would be “how does all of this affect the home that I am planning to sell or potentially buy?”
Every home is unique and a detailed analysis of your property and neighborhood is a necessity to fully understand the true market value and whether this is the right time to buy or sell.
There are many criteria both objective and subjective that must be analyzed in order to get a true picture.
Internet home pricing sites that claim to calculate your home’s value using only algorithms can be wildly inaccurate. Many market analysis from real estate agents that have not taken the time to personally tour the home can also be seriously flawed. Today’s volatility demands that you get a broker who thoroughly understands this rapidly changing market.
Whether you are buying or selling a home, we would welcome the opportunity to have a conversation about your real estate needs, goals and expectations.