
SEPTEMBER 2026 MARKET ANALYSIS FOR CHICAGO'S NORTH SIDE
Our monthly market analysis details six real estate metrics for the Near North Side, Lincoln Park, Lakeview and North Center comparing four neighborhoods and price ranges. There is also a button for each metric which shows detailed, interactive charts for monthly, YTD and ten year trends.
AUGUST OVERVIEW
August continued to reflect a market defined by limited inventory and selective buyer activity. Closed sales and pending contracts both finished below last year's levels, while the number of homes available for sale remained significantly lower across nearly every neighborhood and price range.
Despite softer transaction volume, pricing remained resilient. Median prices increased in Near North, Lincoln Park and Lakeview, with particularly strong gains in Lincoln Park, while North Center moved modestly lower. The combination of fewer homes for sale and months of supply remaining well below balanced-market levels continues to support values for well-positioned properties.
Overall, the late-summer market continues to favor sellers of desirable, appropriately priced homes, but buyers are becoming more selective. The clearest opportunity remains with properties that combine strong condition, location and realistic pricing, while limited new listing activity continues to restrict buyer choice.
Please let us know if you need information on any of Chicago’s other neighborhoo
AUGUST HOME SALES
Year To Date 2026 vs 2025 - Down 6.7%
August 2026 vs 2025 - Down 14.0%
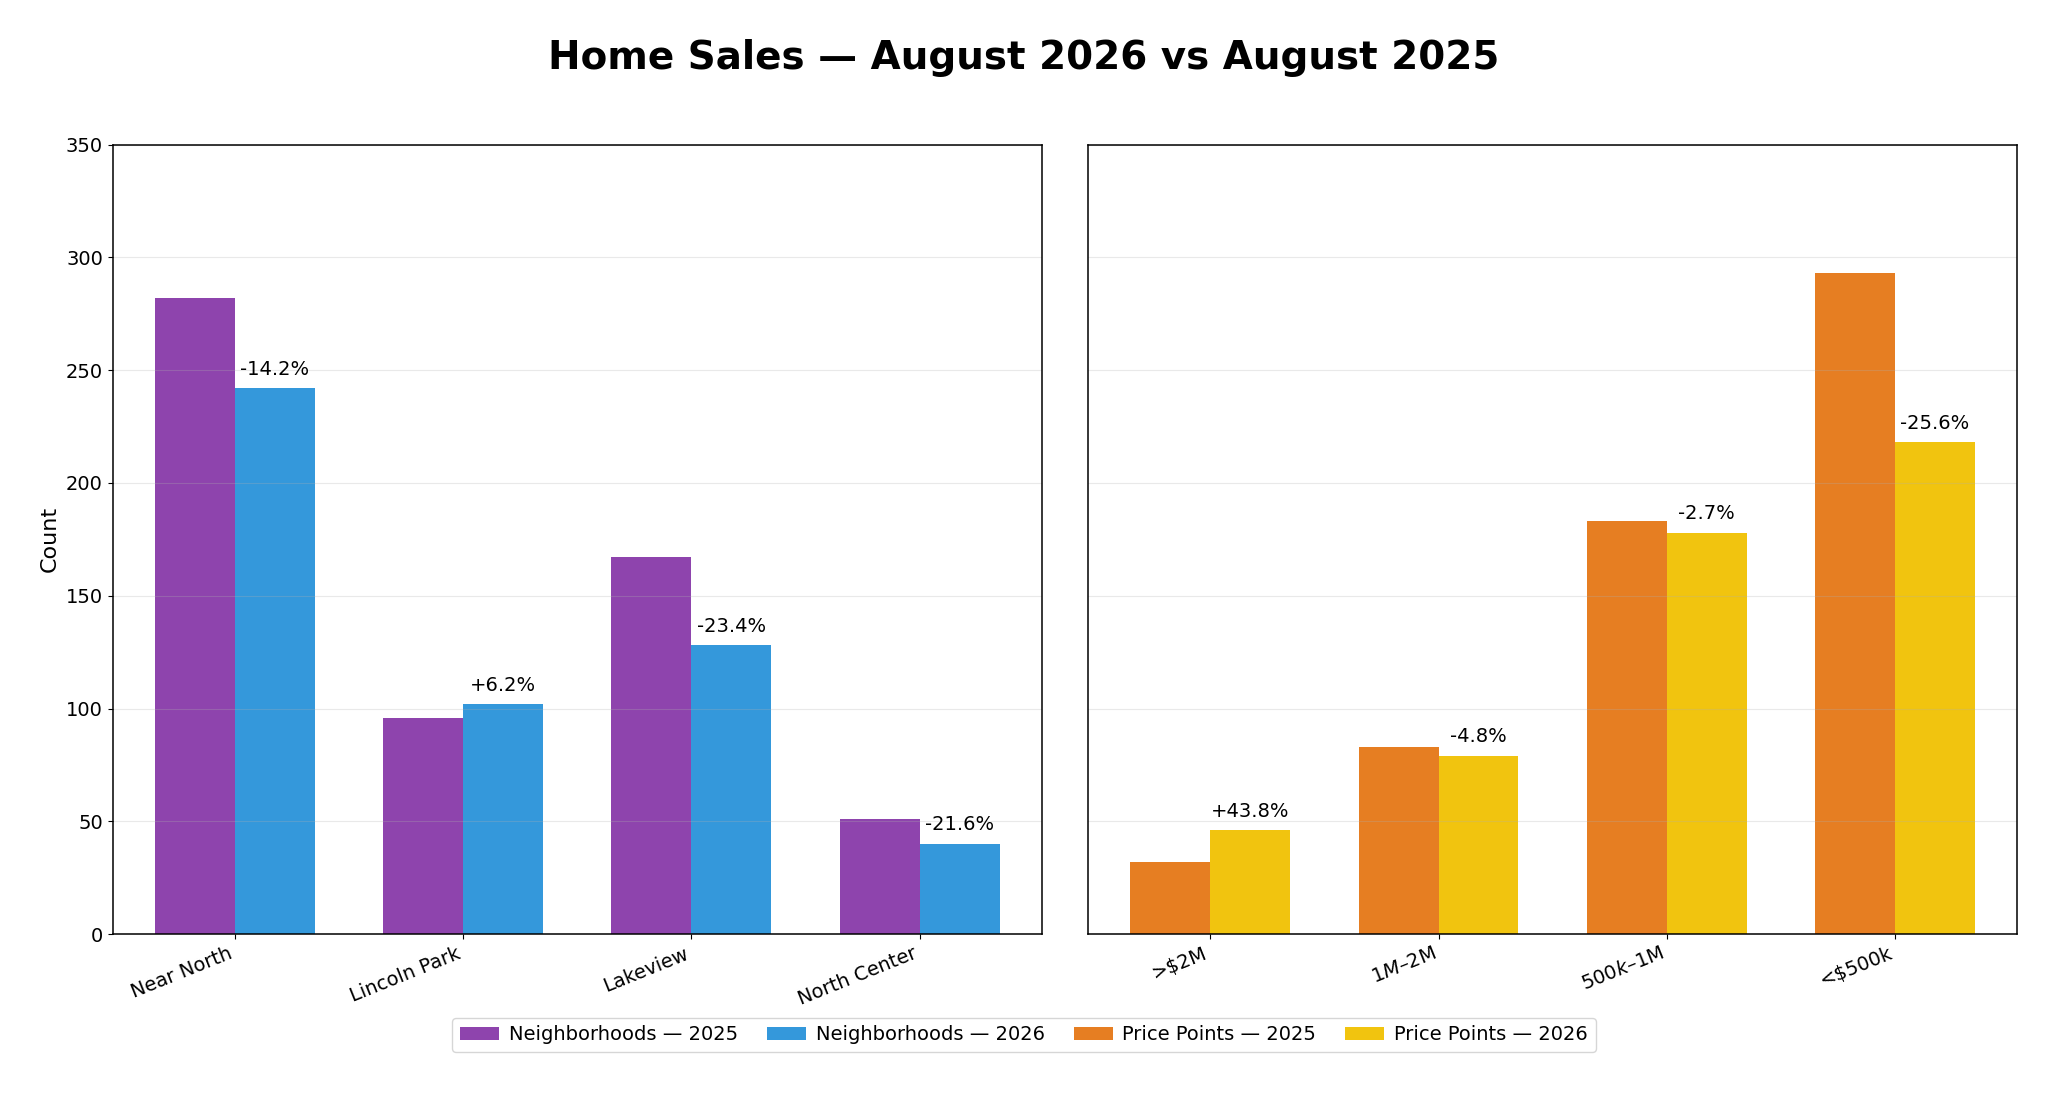
NOTEWORTHY: Overall home sales declined 14.0% compared with last August, with performance varying meaningfully by neighborhood. Lincoln Park was the only neighborhood to post an increase, while Near North, Lakeview and North Center all recorded fewer closings than a year ago.
By price range, the luxury market above $2 million was the clear exception, with sales increasing more than 43%. Activity between $1 million and $2 million and between $500,000 and $1 million was relatively close to last year's pace, while sales below $500,000 declined sharply. The results suggest demand remains present, but it is increasingly concentrated in select segments of the market.
AUGUST HOMES UNDER CONTRACT
Year To Date 2026 vs 2025 - Down 6.1%
August 2026 vs 2025 - Down 13.7%
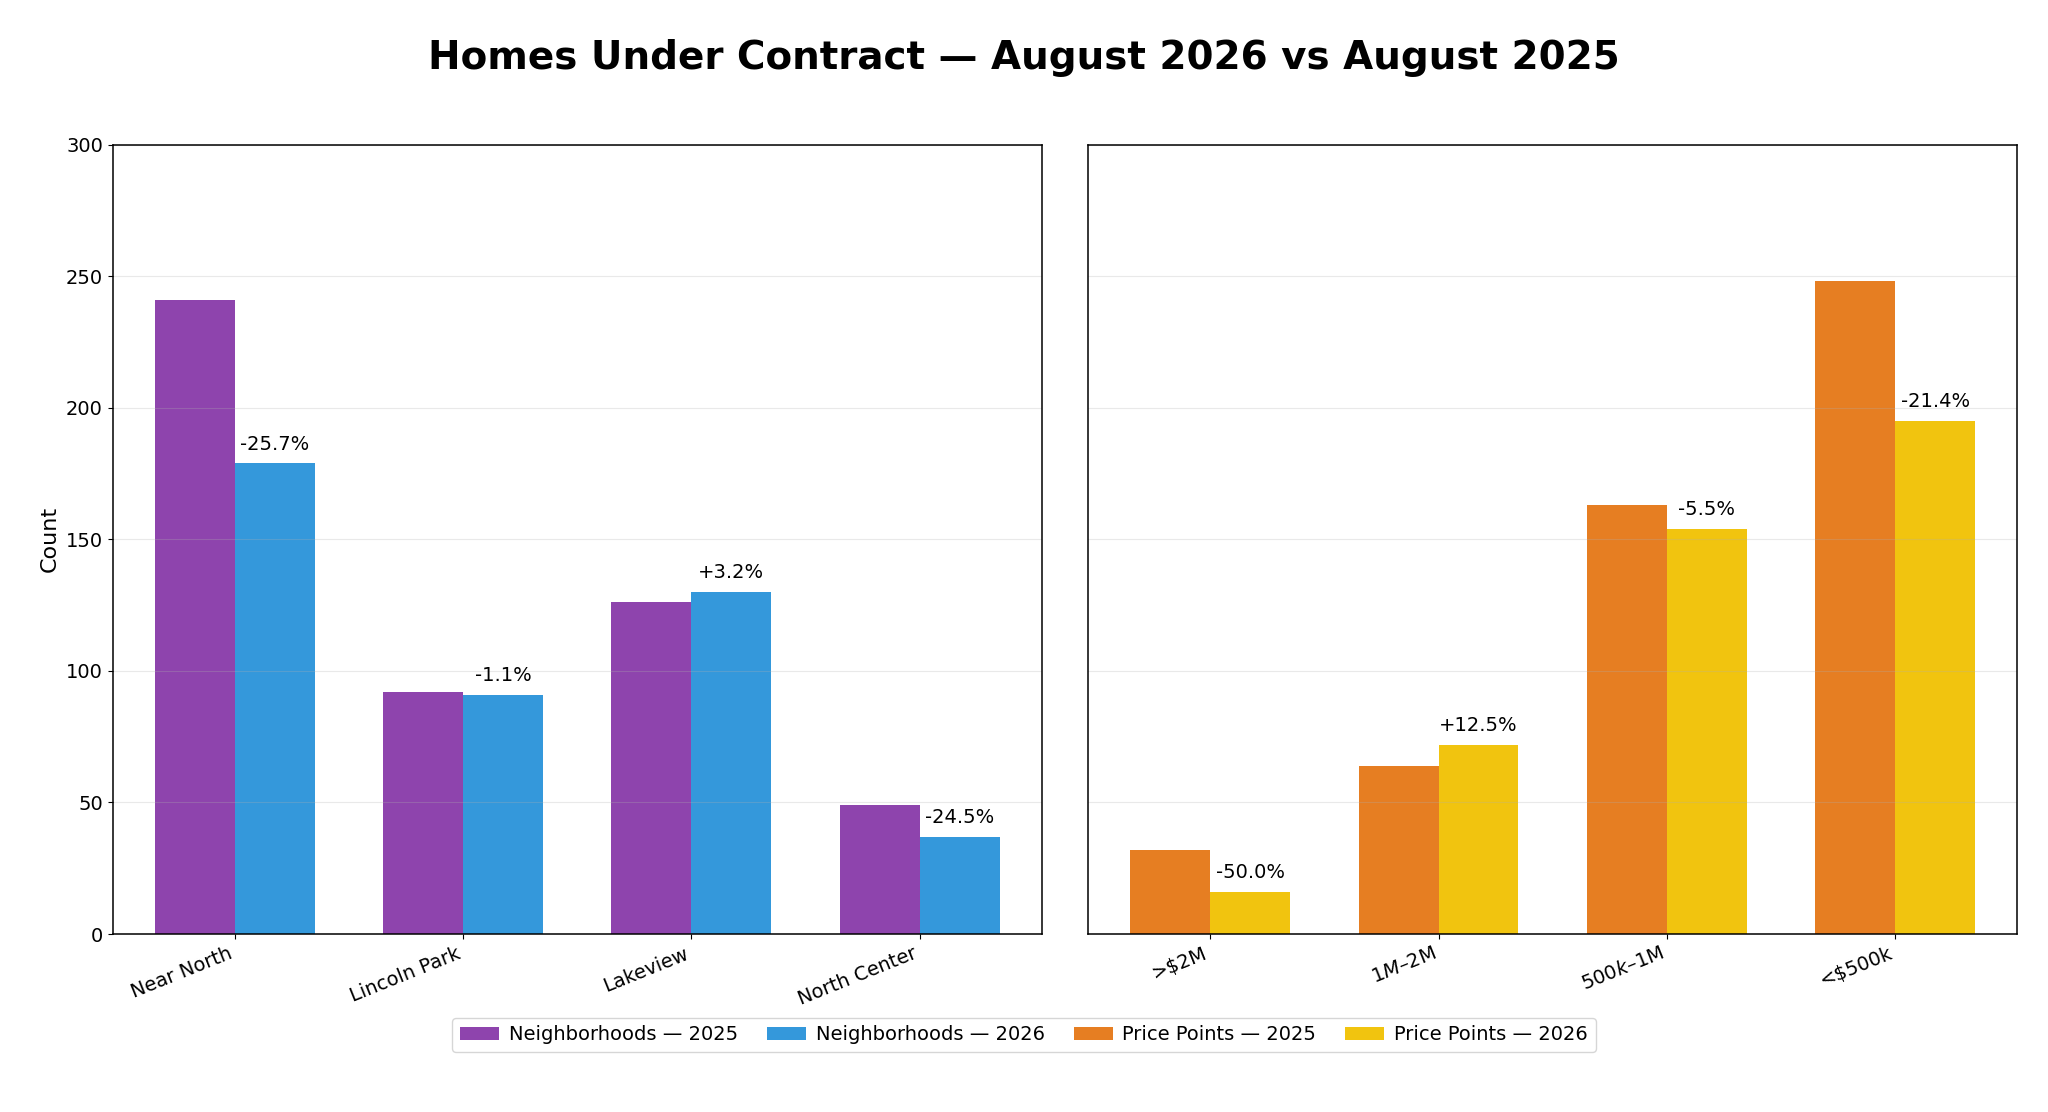
Noteworthy : Pending contract activity declined 13.7% from last August, indicating that buyers remained active but continued to make more deliberate purchasing decisions. Lakeview was the only neighborhood to finish above last year's level, while Near North and North Center experienced the largest declines.
The price-range results were mixed. Contracts increased in the $1 million to $2 million segment, while activity above $2 million and below $500,000 fell more substantially. Overall, the market continues to reward homes that are well positioned on price and condition, while buyers appear less willing to stretch for properties that do not clearly demonstrate value.
AUGUST HOMES FOR SALE
Year To Date 2026 vs 2025 - Down 25.8%
July 2026 vs 2025 - Down 18.4%
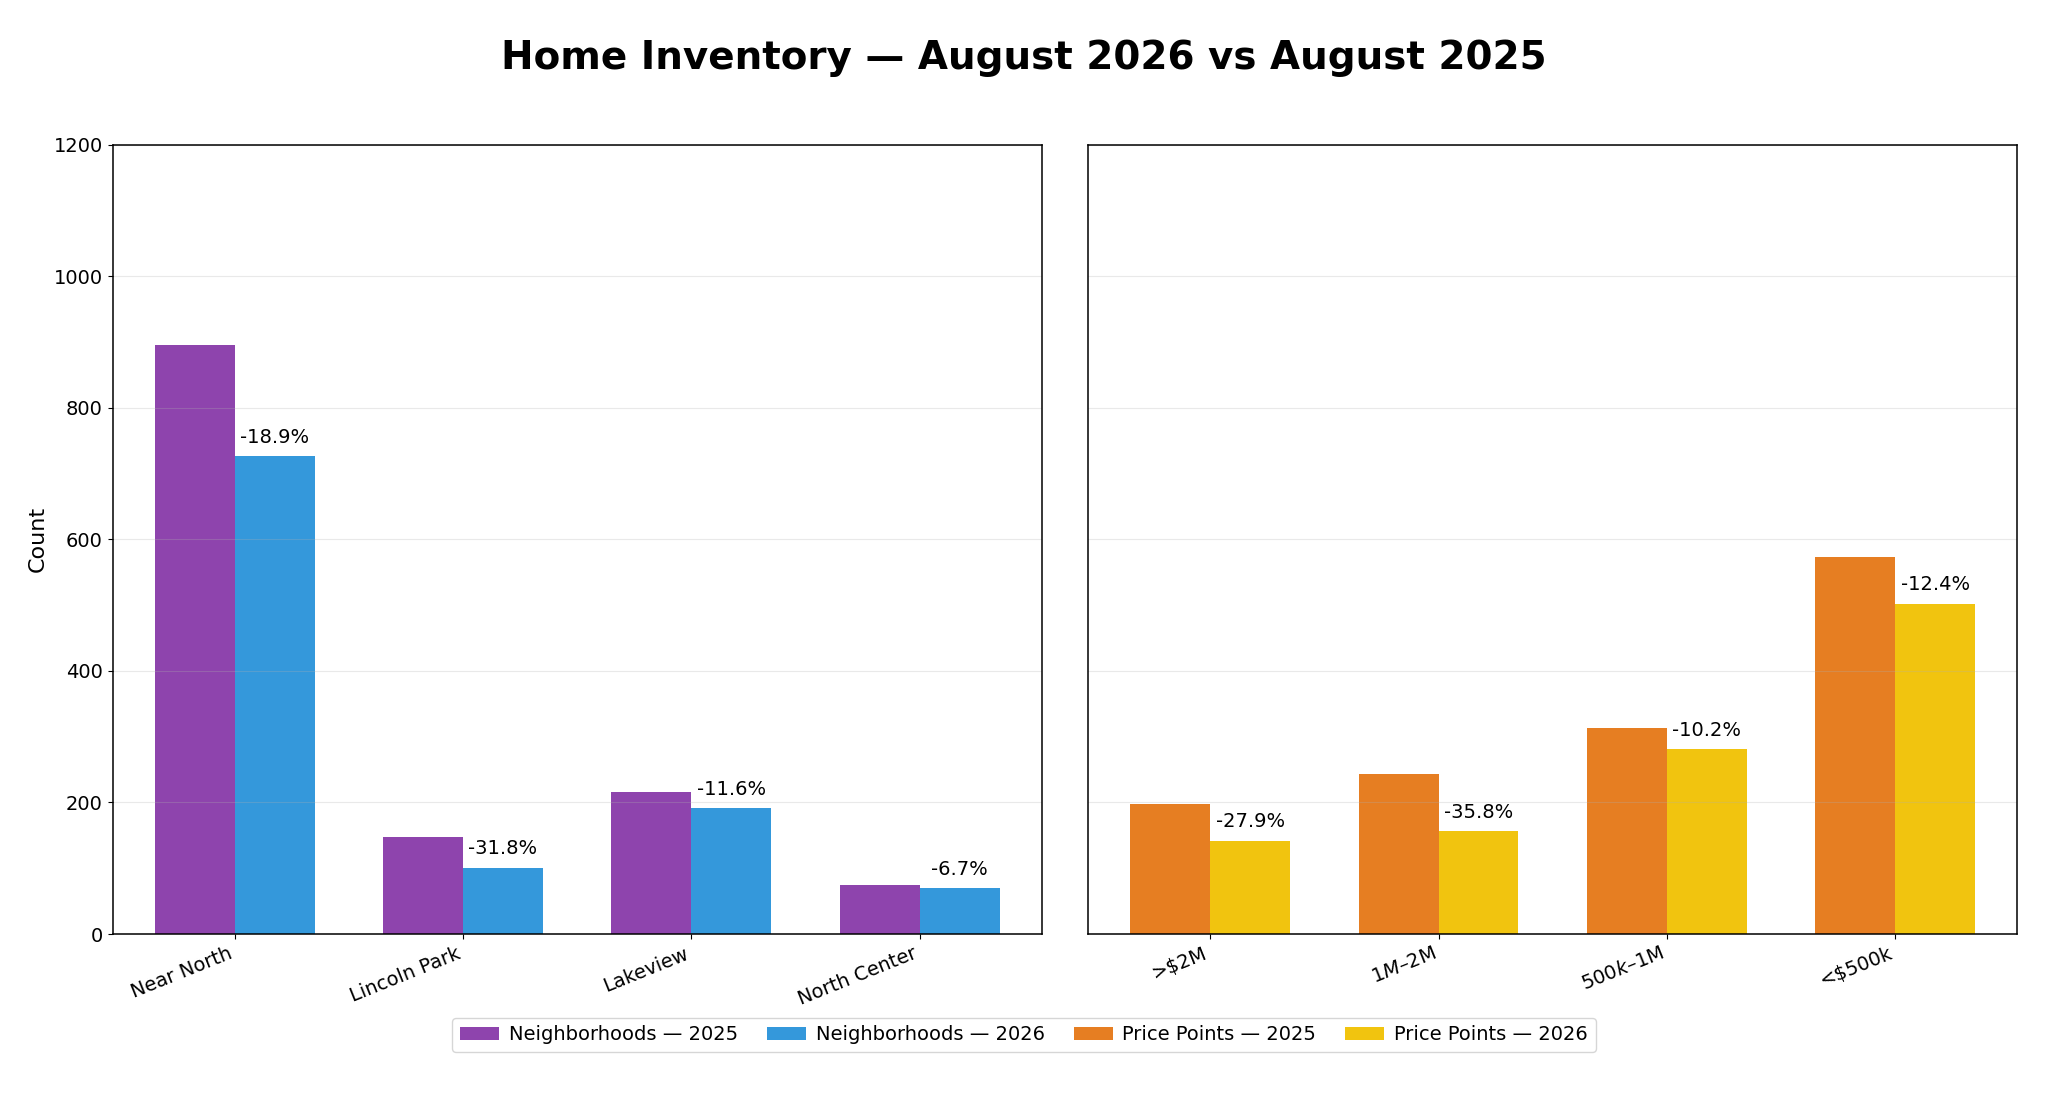
Noteworthy: Inventory remained tight in August, with the total number of homes for sale down 18.4% from a year ago. All four neighborhoods continued to report fewer available properties, with the largest percentage decline occurring in Lincoln Park.
Every major price range also remained below last year's inventory level. The continued shortage of available homes is limiting buyer choice and helping support pricing even as overall sales activity has moderated. Until listing activity improves meaningfully, inventory is likely to remain the primary factor shaping market conditions.
AUGUST MONTHS OF SUPPLY OF INVENTORY
Year To Date 2026 vs 2025 - Down 26.0% to 1.7 MSI
July 2026 vs 2025 - Down 14.2% to 1.8 MSI
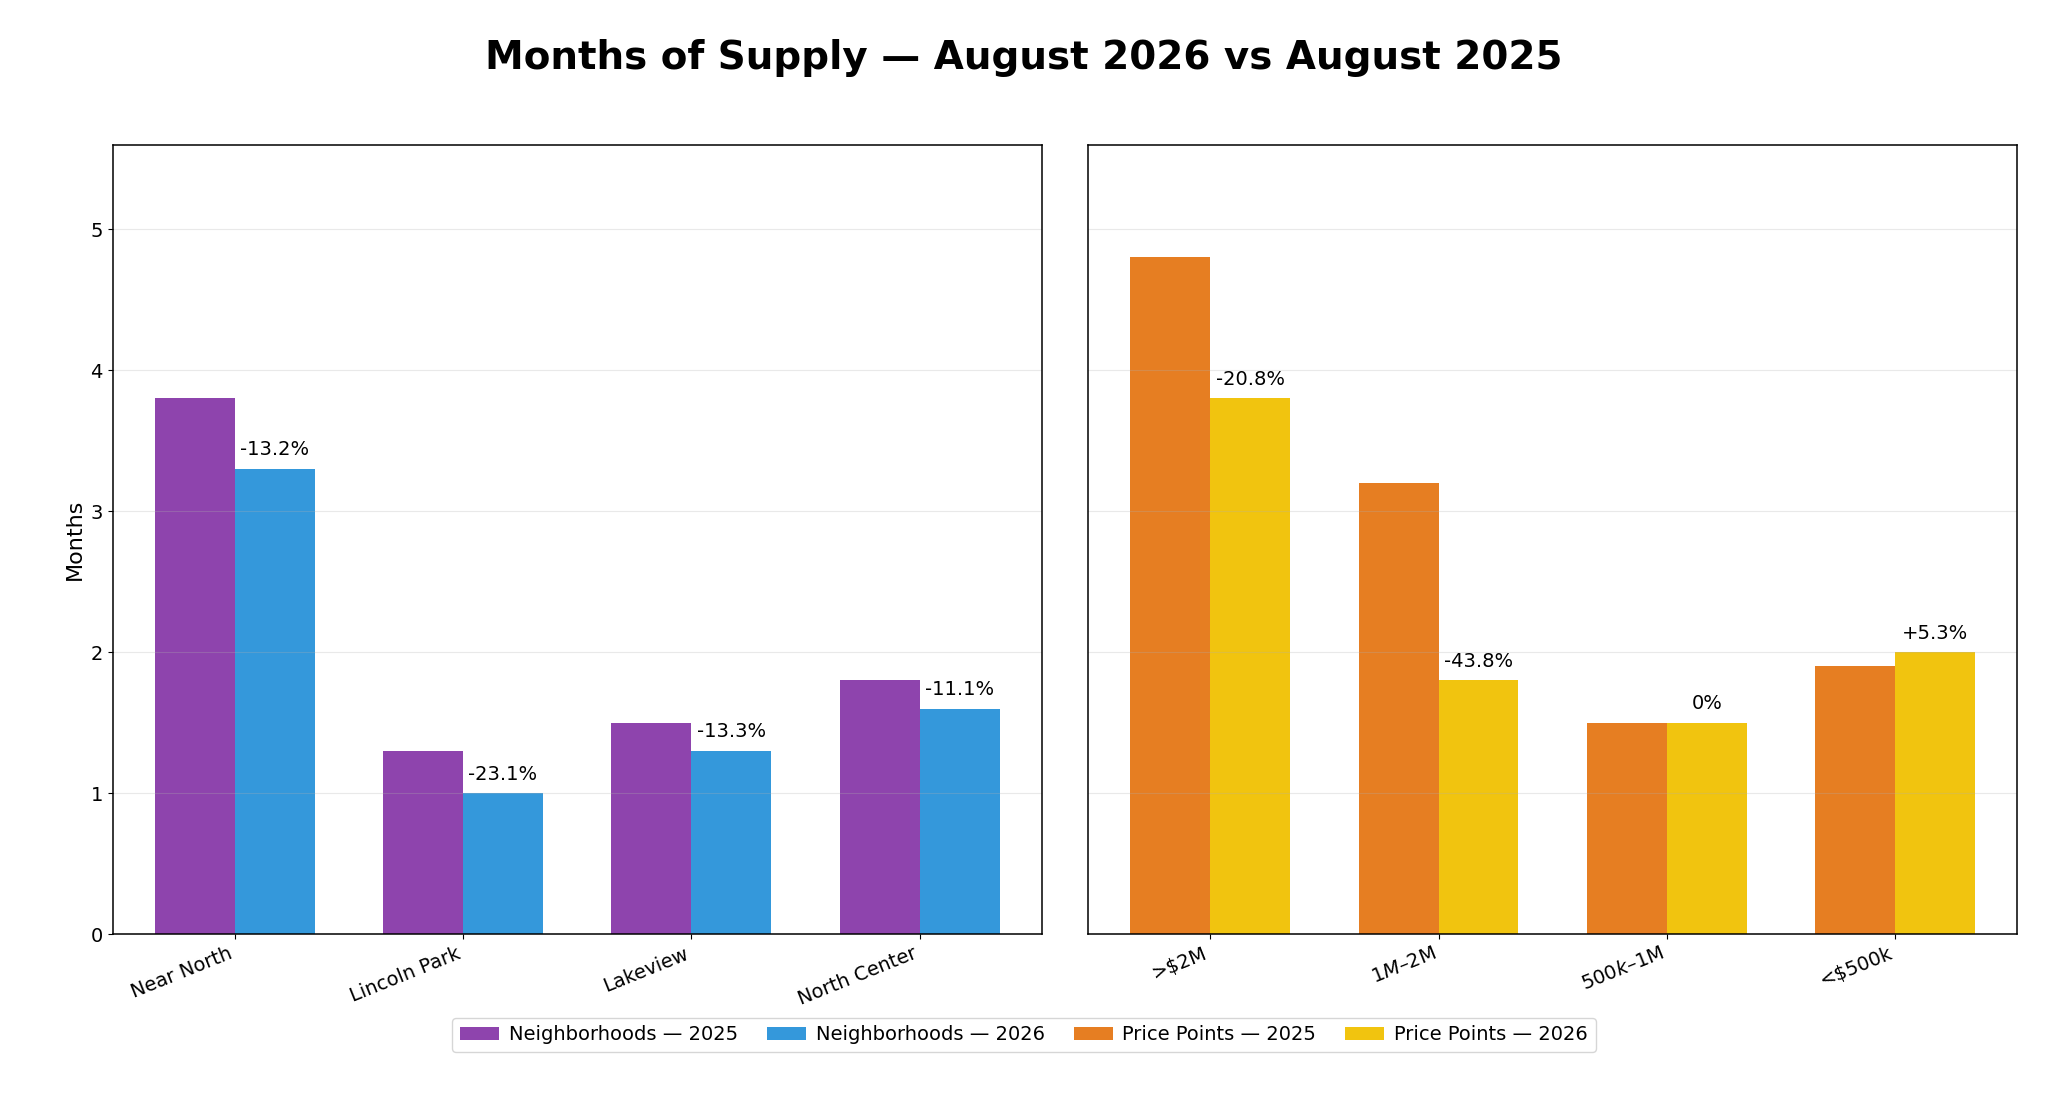
Noteworthy : Months of supply declined 14.2% overall to 1.8 months, reinforcing that the market remains well below the inventory level typically associated with balanced conditions. Supply decreased in every neighborhood, with Lincoln Park showing the largest year-over-year reduction.
By price range, supply tightened most significantly between $1 million and $2 million and remained lower above $2 million. The $500,000 to $1 million segment was essentially unchanged, while homes below $500,000 showed a modest increase in supply. Even with those differences, overall inventory remains limited enough to support favorable conditions for well-positioned sellers.
AUGUST MEDIAN PRICING
Year To Date 2026 vs 2025 - Up 10.9%
August 2026 vs 2025 - Up 10.3%
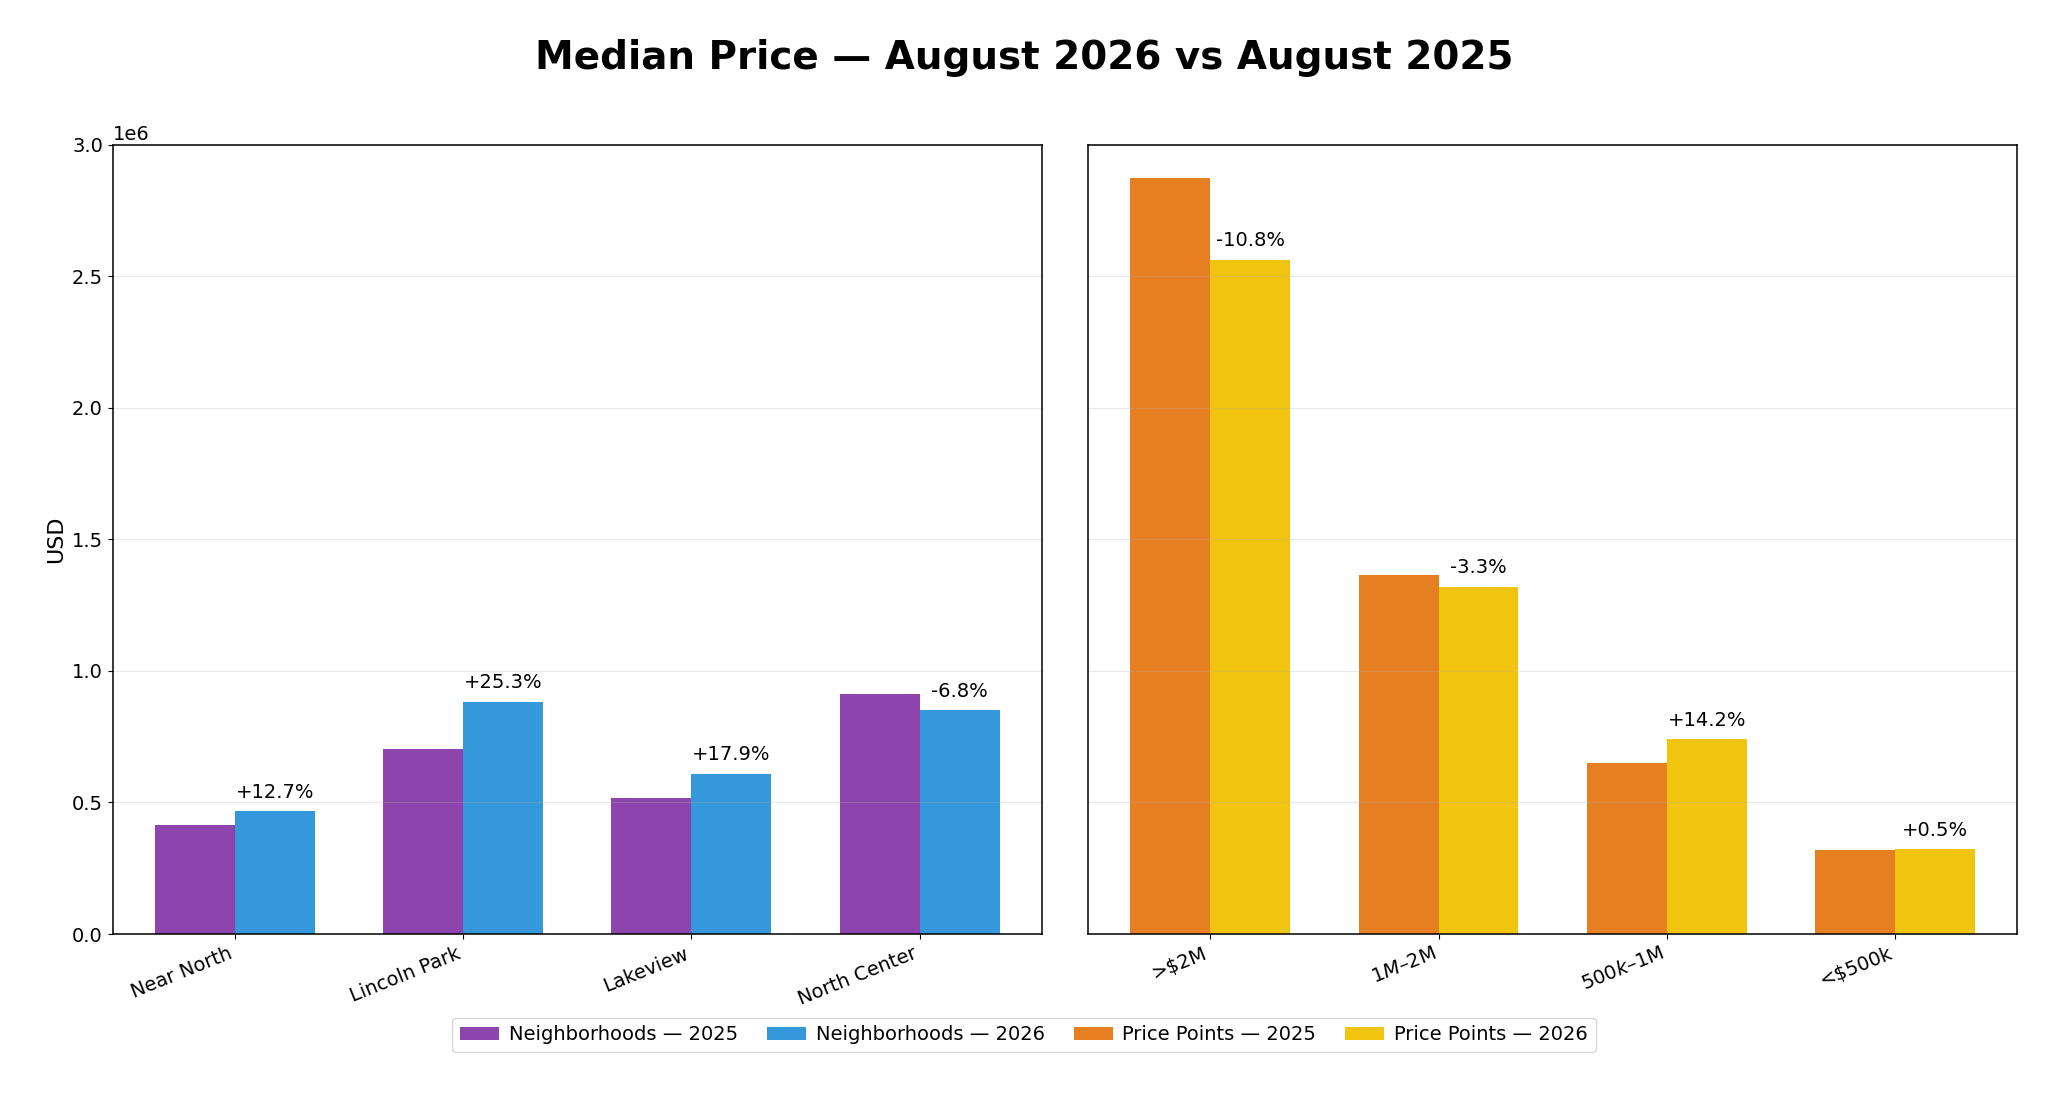
Noteworthy : Median pricing remained strong in August, with the overall median price increasing approximately 10% from a year ago. Lincoln Park posted the strongest neighborhood gain, followed by Lakeview and Near North, while North Center moved modestly lower.
Price-range performance was more mixed. Median prices increased in the $500,000 to $1 million segment and were essentially stable below $500,000, while the $1 million to $2 million and luxury segments finished below last year's levels. Overall, limited inventory continues to provide meaningful support for home values despite slower transaction activity.
AUGUST NEW LISTINGS
Year To Date 2026 vs 2025- Down 12.3%
August 2026 vs 2025 - Down 3.2%
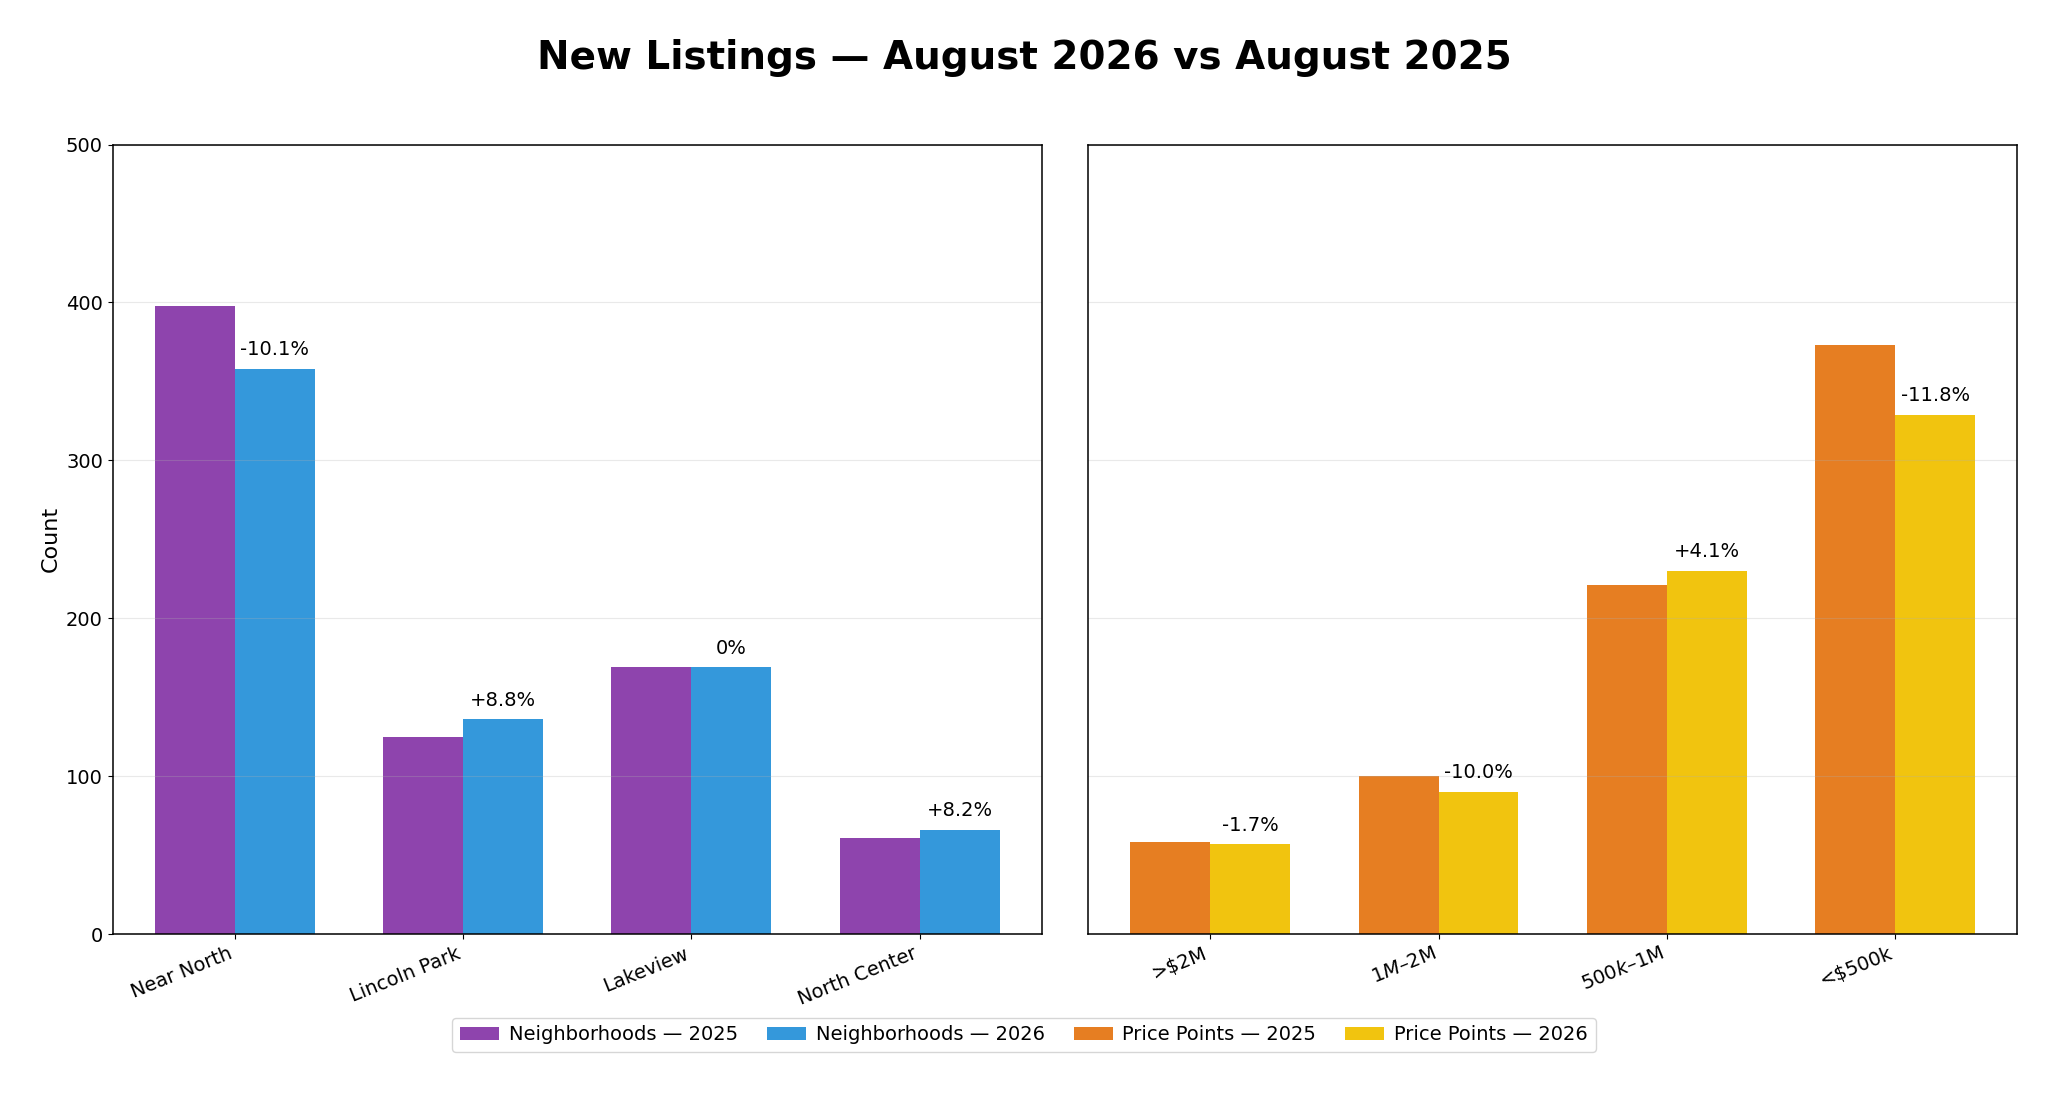
Noteworthy : New listing activity was relatively close to last year's pace overall, declining 3.2%, but results varied considerably by neighborhood. Lincoln Park and North Center recorded increases, Lakeview was unchanged, and Near North posted fewer new listings.
By price range, new listings increased between $500,000 and $1 million but declined in the other major segments, including the $1 million to $2 million range and homes below $500,000. The market is seeing some improvement in new supply, but not enough to materially change the broader inventory shortage heading into fall.
YOUR HOME
A logical question would be “how does all of this affect the home that I am planning to sell or potentially buy?”
Every home is unique and a detailed analysis of your property and neighborhood is a necessity to fully understand the true market value and whether this is the right time to buy or sell.
There are many criteria both objective and subjective that must be analyzed in order to get a true picture.
Internet home pricing sites that claim to calculate your home’s value using only algorithms can be wildly inaccurate. Many market analysis from real estate agents that have not taken the time to personally tour the home can also be seriously flawed. Today’s volatility demands that you get a broker who thoroughly understands this rapidly changing market.
Whether you are buying or selling a home, we would welcome the opportunity to have a conversation about your real estate needs, goals and expectations.