
NOVEMBER 2025 MARKET ANALYSIS FOR CHICAGO'S NORTH SIDE
Our monthly market analysis details six real estate metrics for the Near North Side, Lincoln Park, Lakeview and North Center, followed by our comprehensive monthly summary.
Please let us know if you need information on any of Chicago’s other neighborhoods
OCTOBER HOME SALES
Year To Date 2025 vs 2024 - Up 4.0%
October 2025 vs 2024 - Up 2.8%
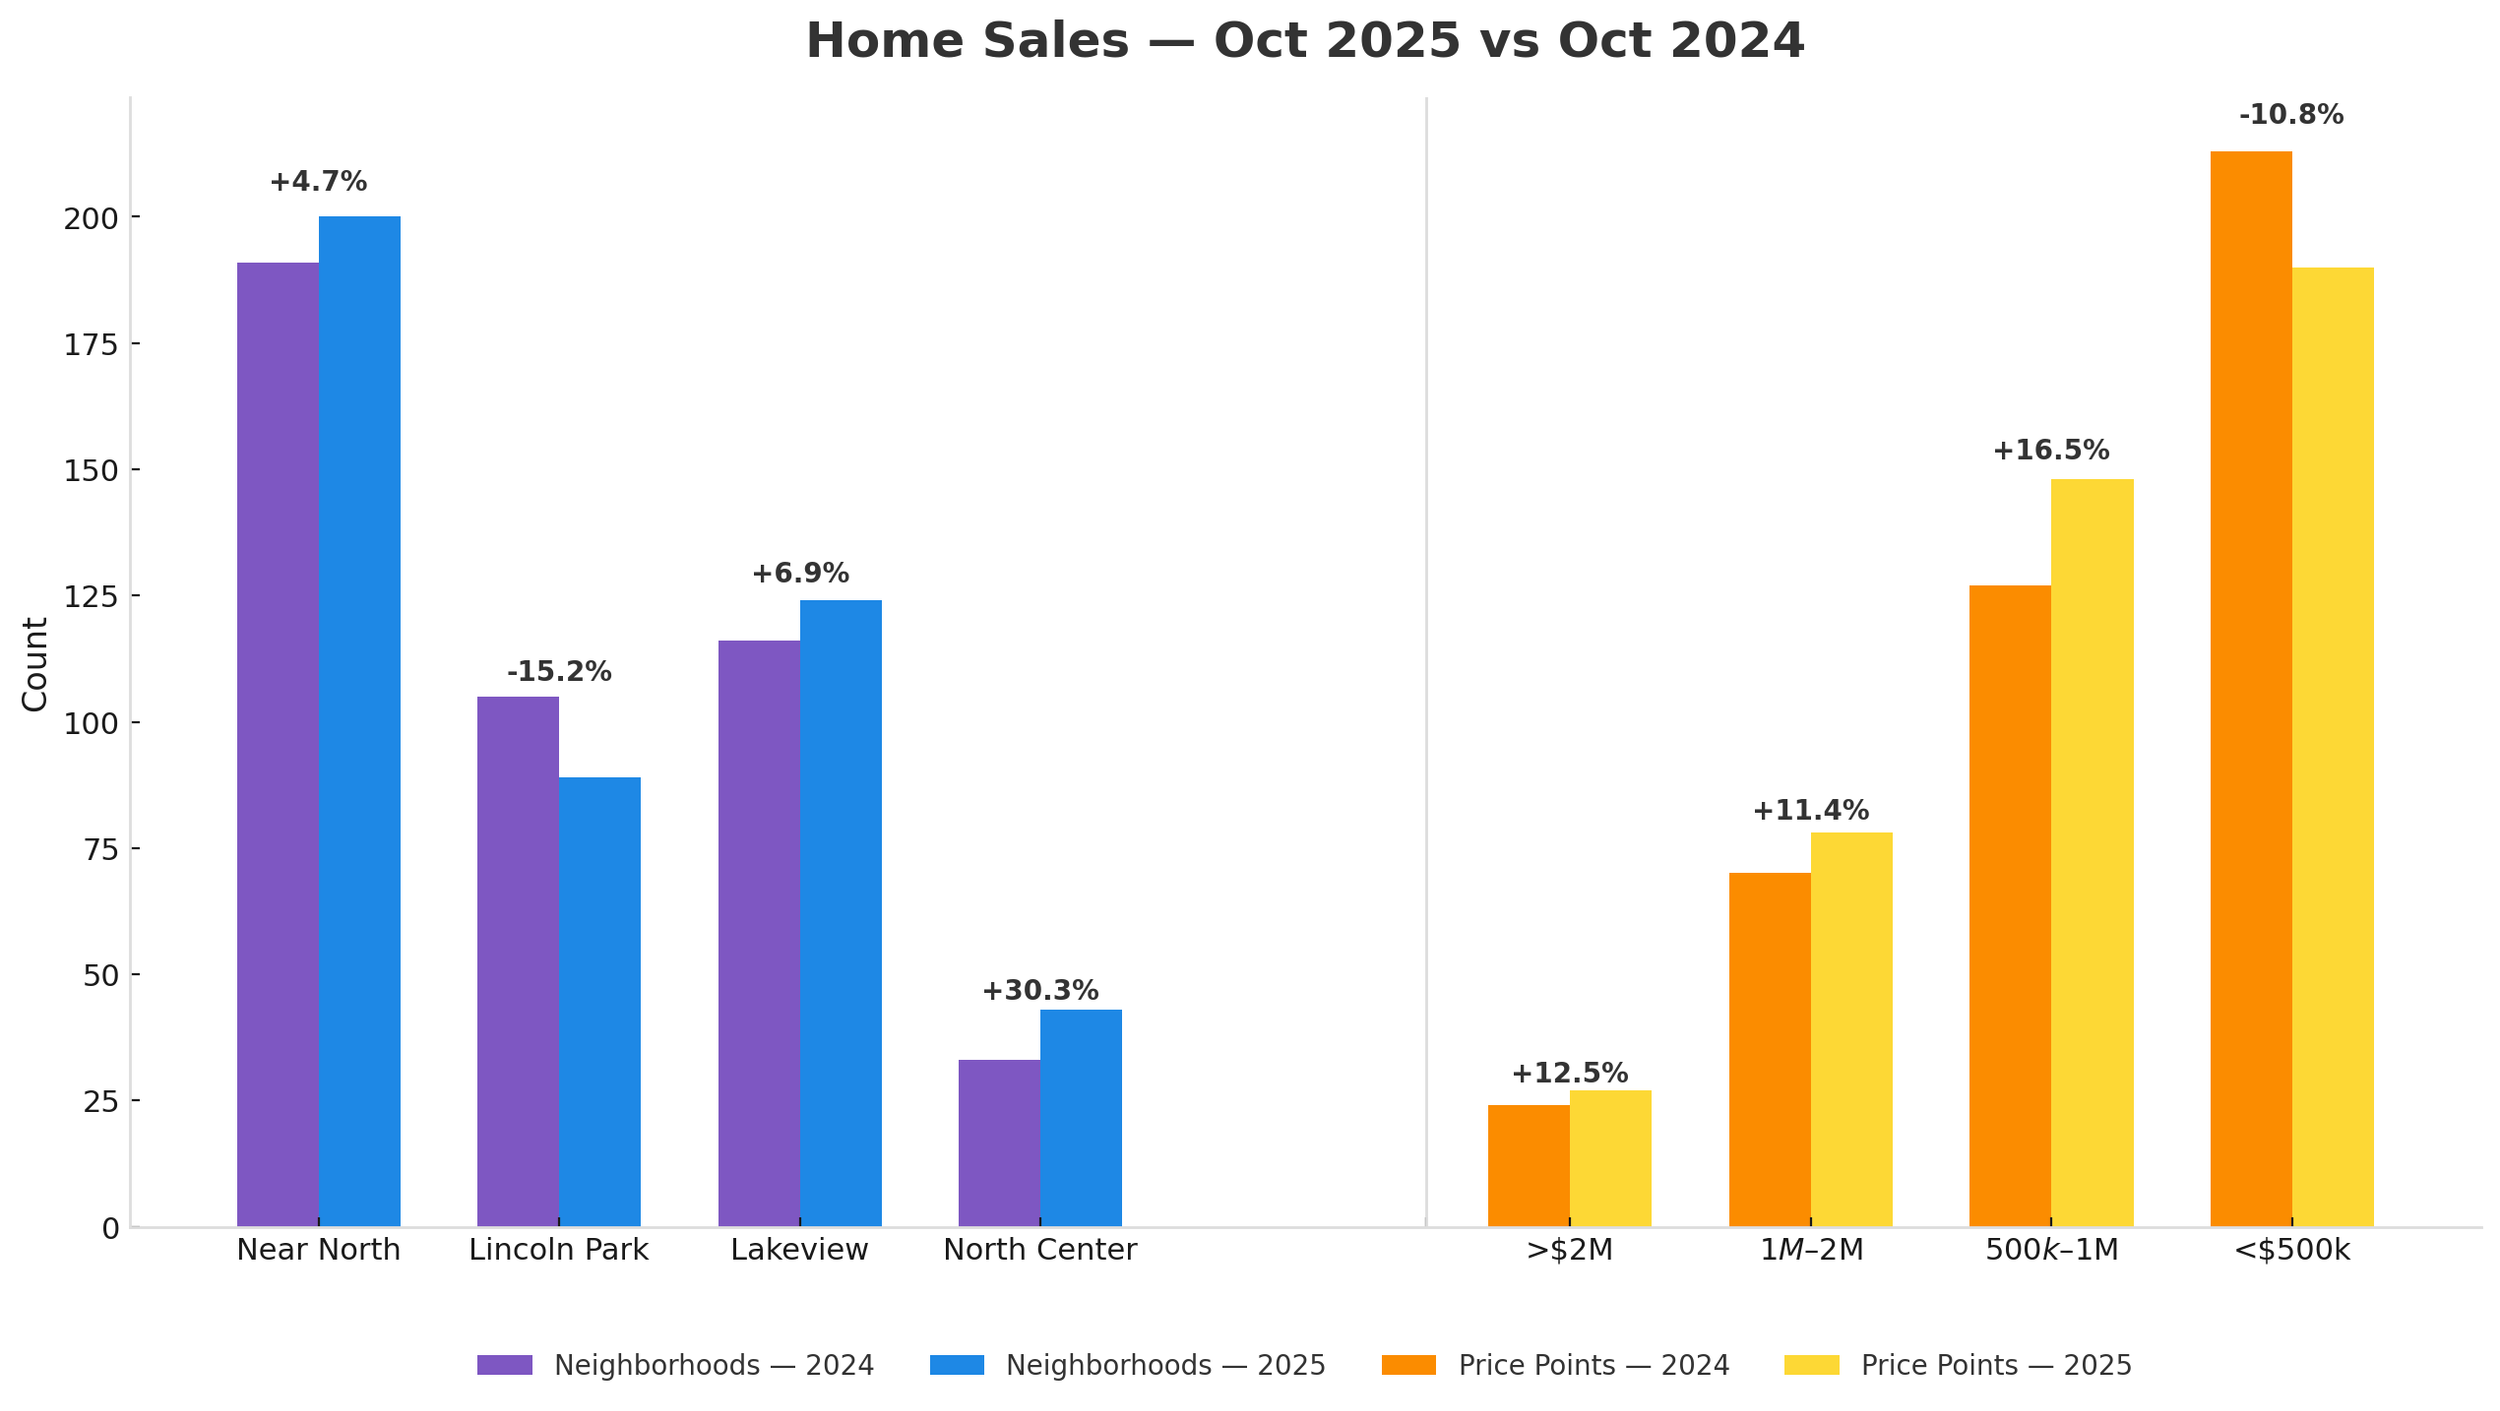
NOTEWORTHY:
Despite historically low inventory levels, October 2025 home sales rose for the second consecutive month vs 2024.
OCTOBER HOMES UNDER CONTRACT
Year To Date 2025 vs 2024 - Up 2.6%
October 2025 vs 2024 - Up 10.1%
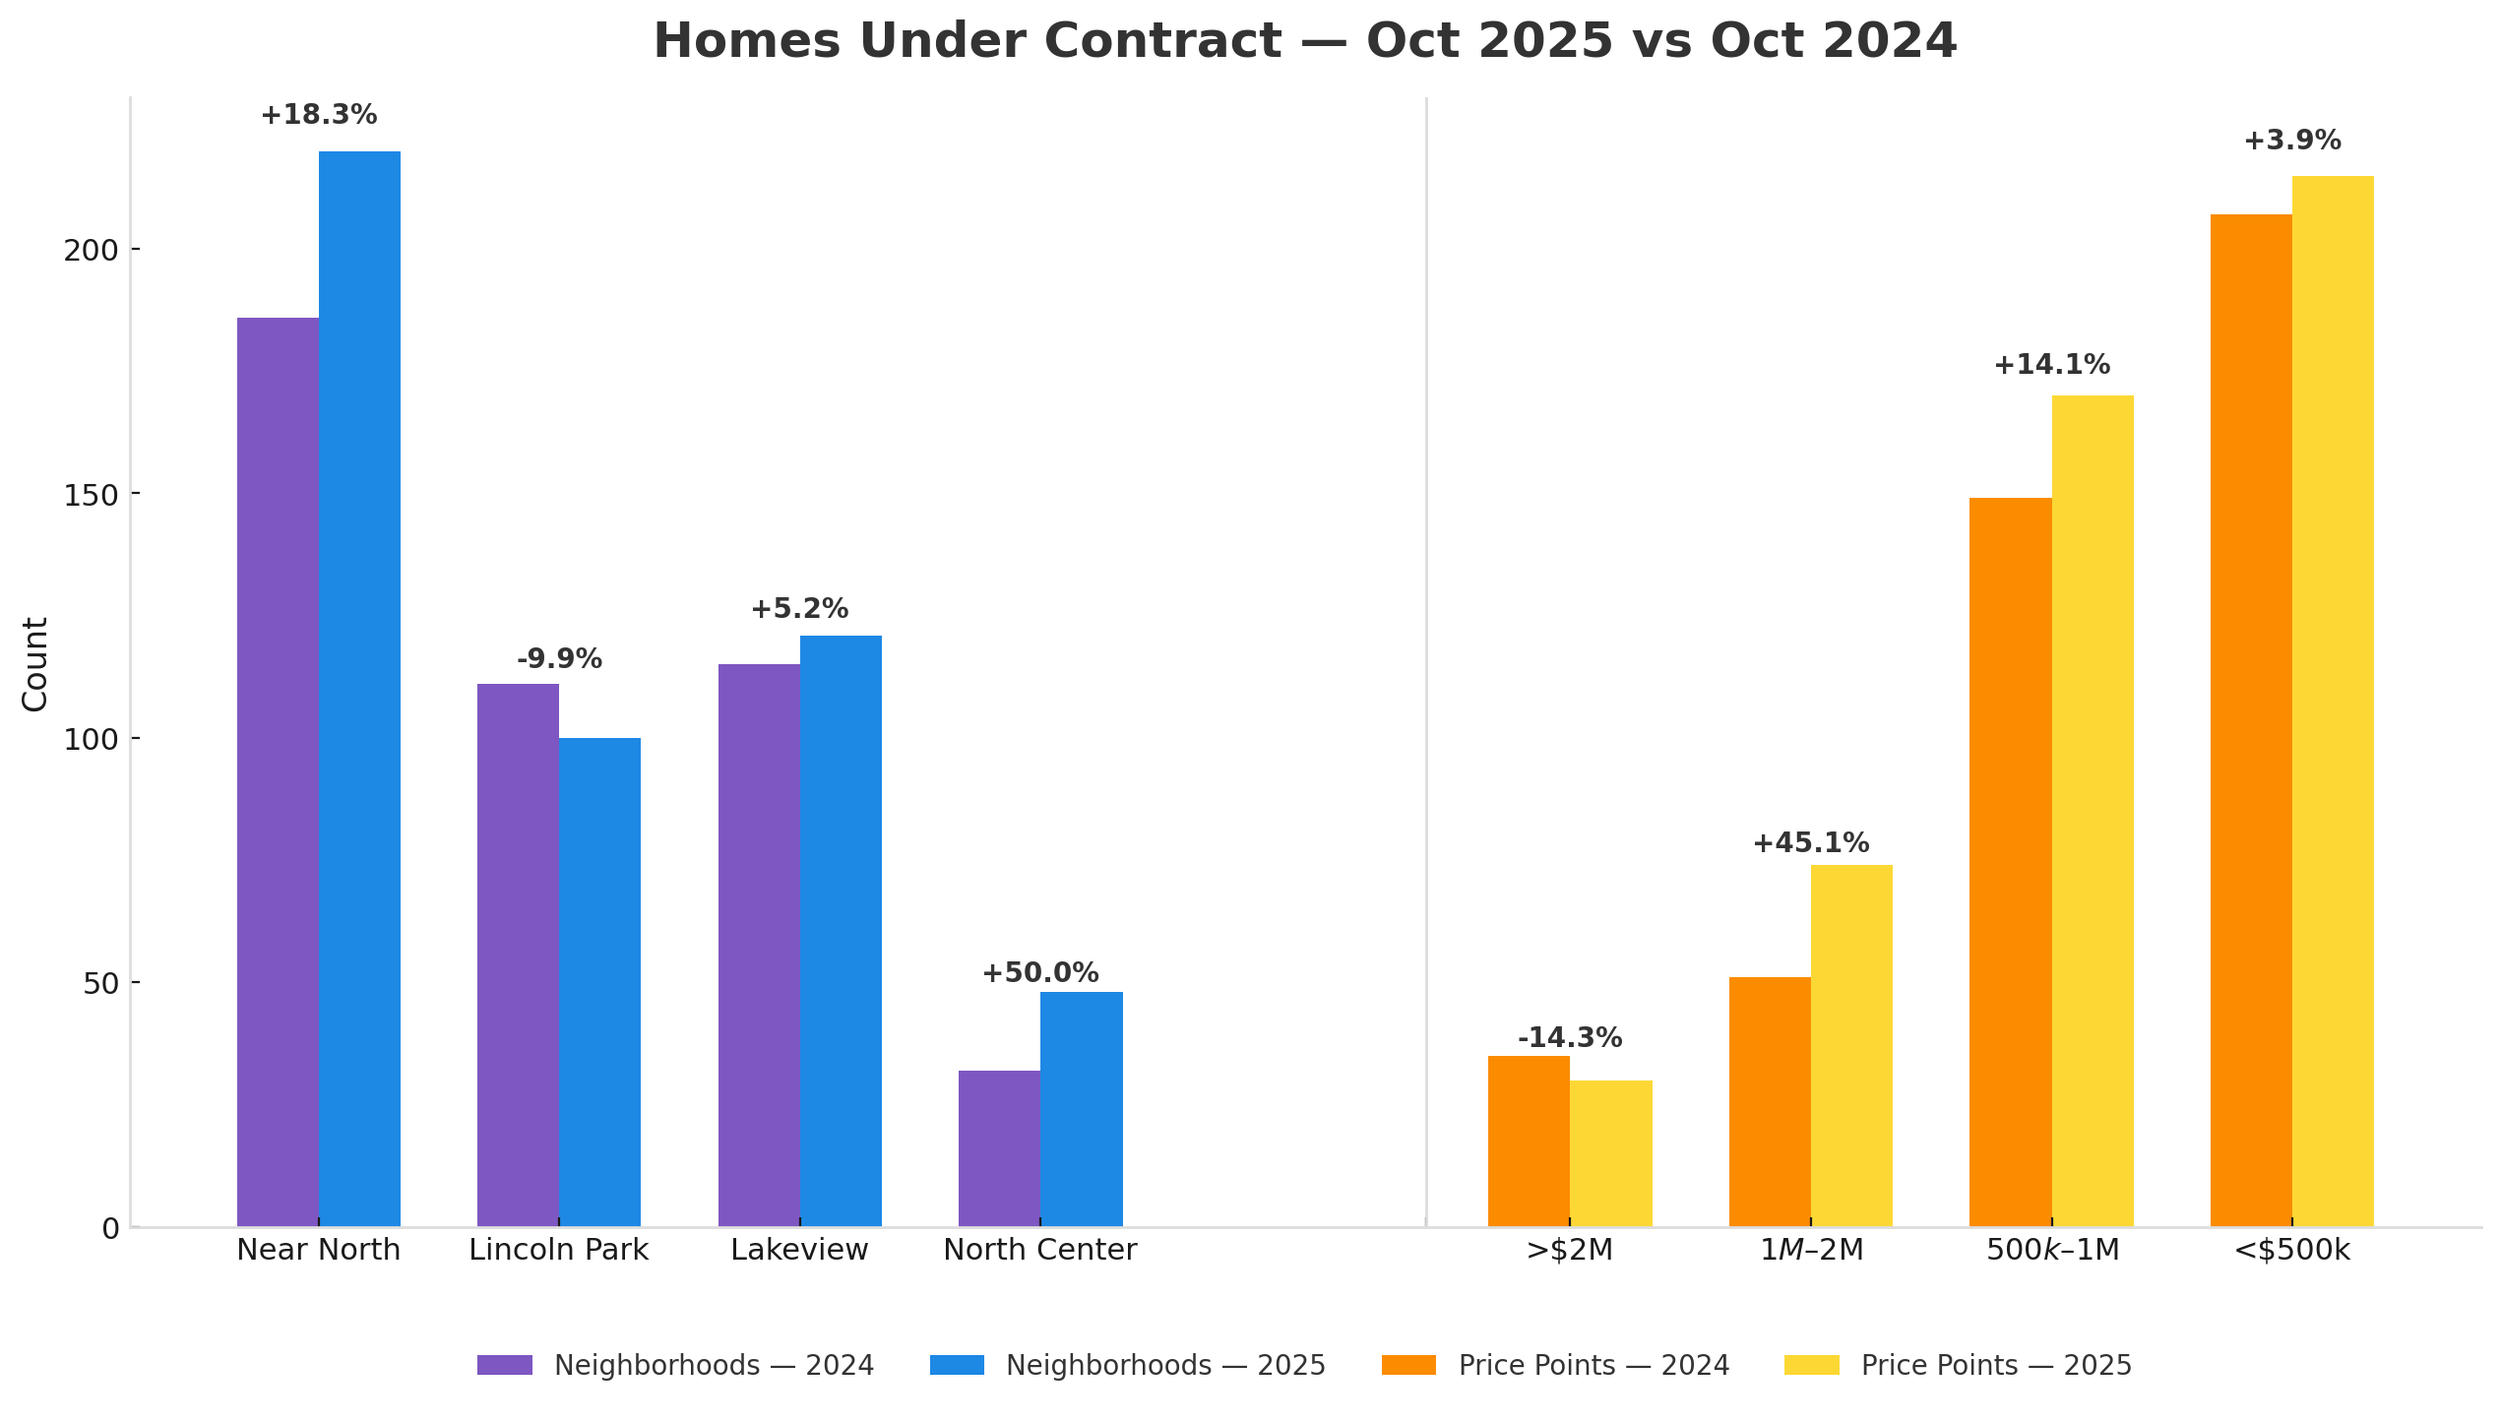
Noteworthy :
Most home sales that closed this month went under contract in a previous month. Units Under Contract reflects a more accurate picture of the current month, although not every home that goes under contract closes. The October 2025 10.1 % increase over 2024 could be a positive sign for November home sales.
OCTOBER HOMES FOR SALE
Year To Date 2025 vs 2024 - Down 20.5%
October 2025 vs 2024 - Down 28.4%
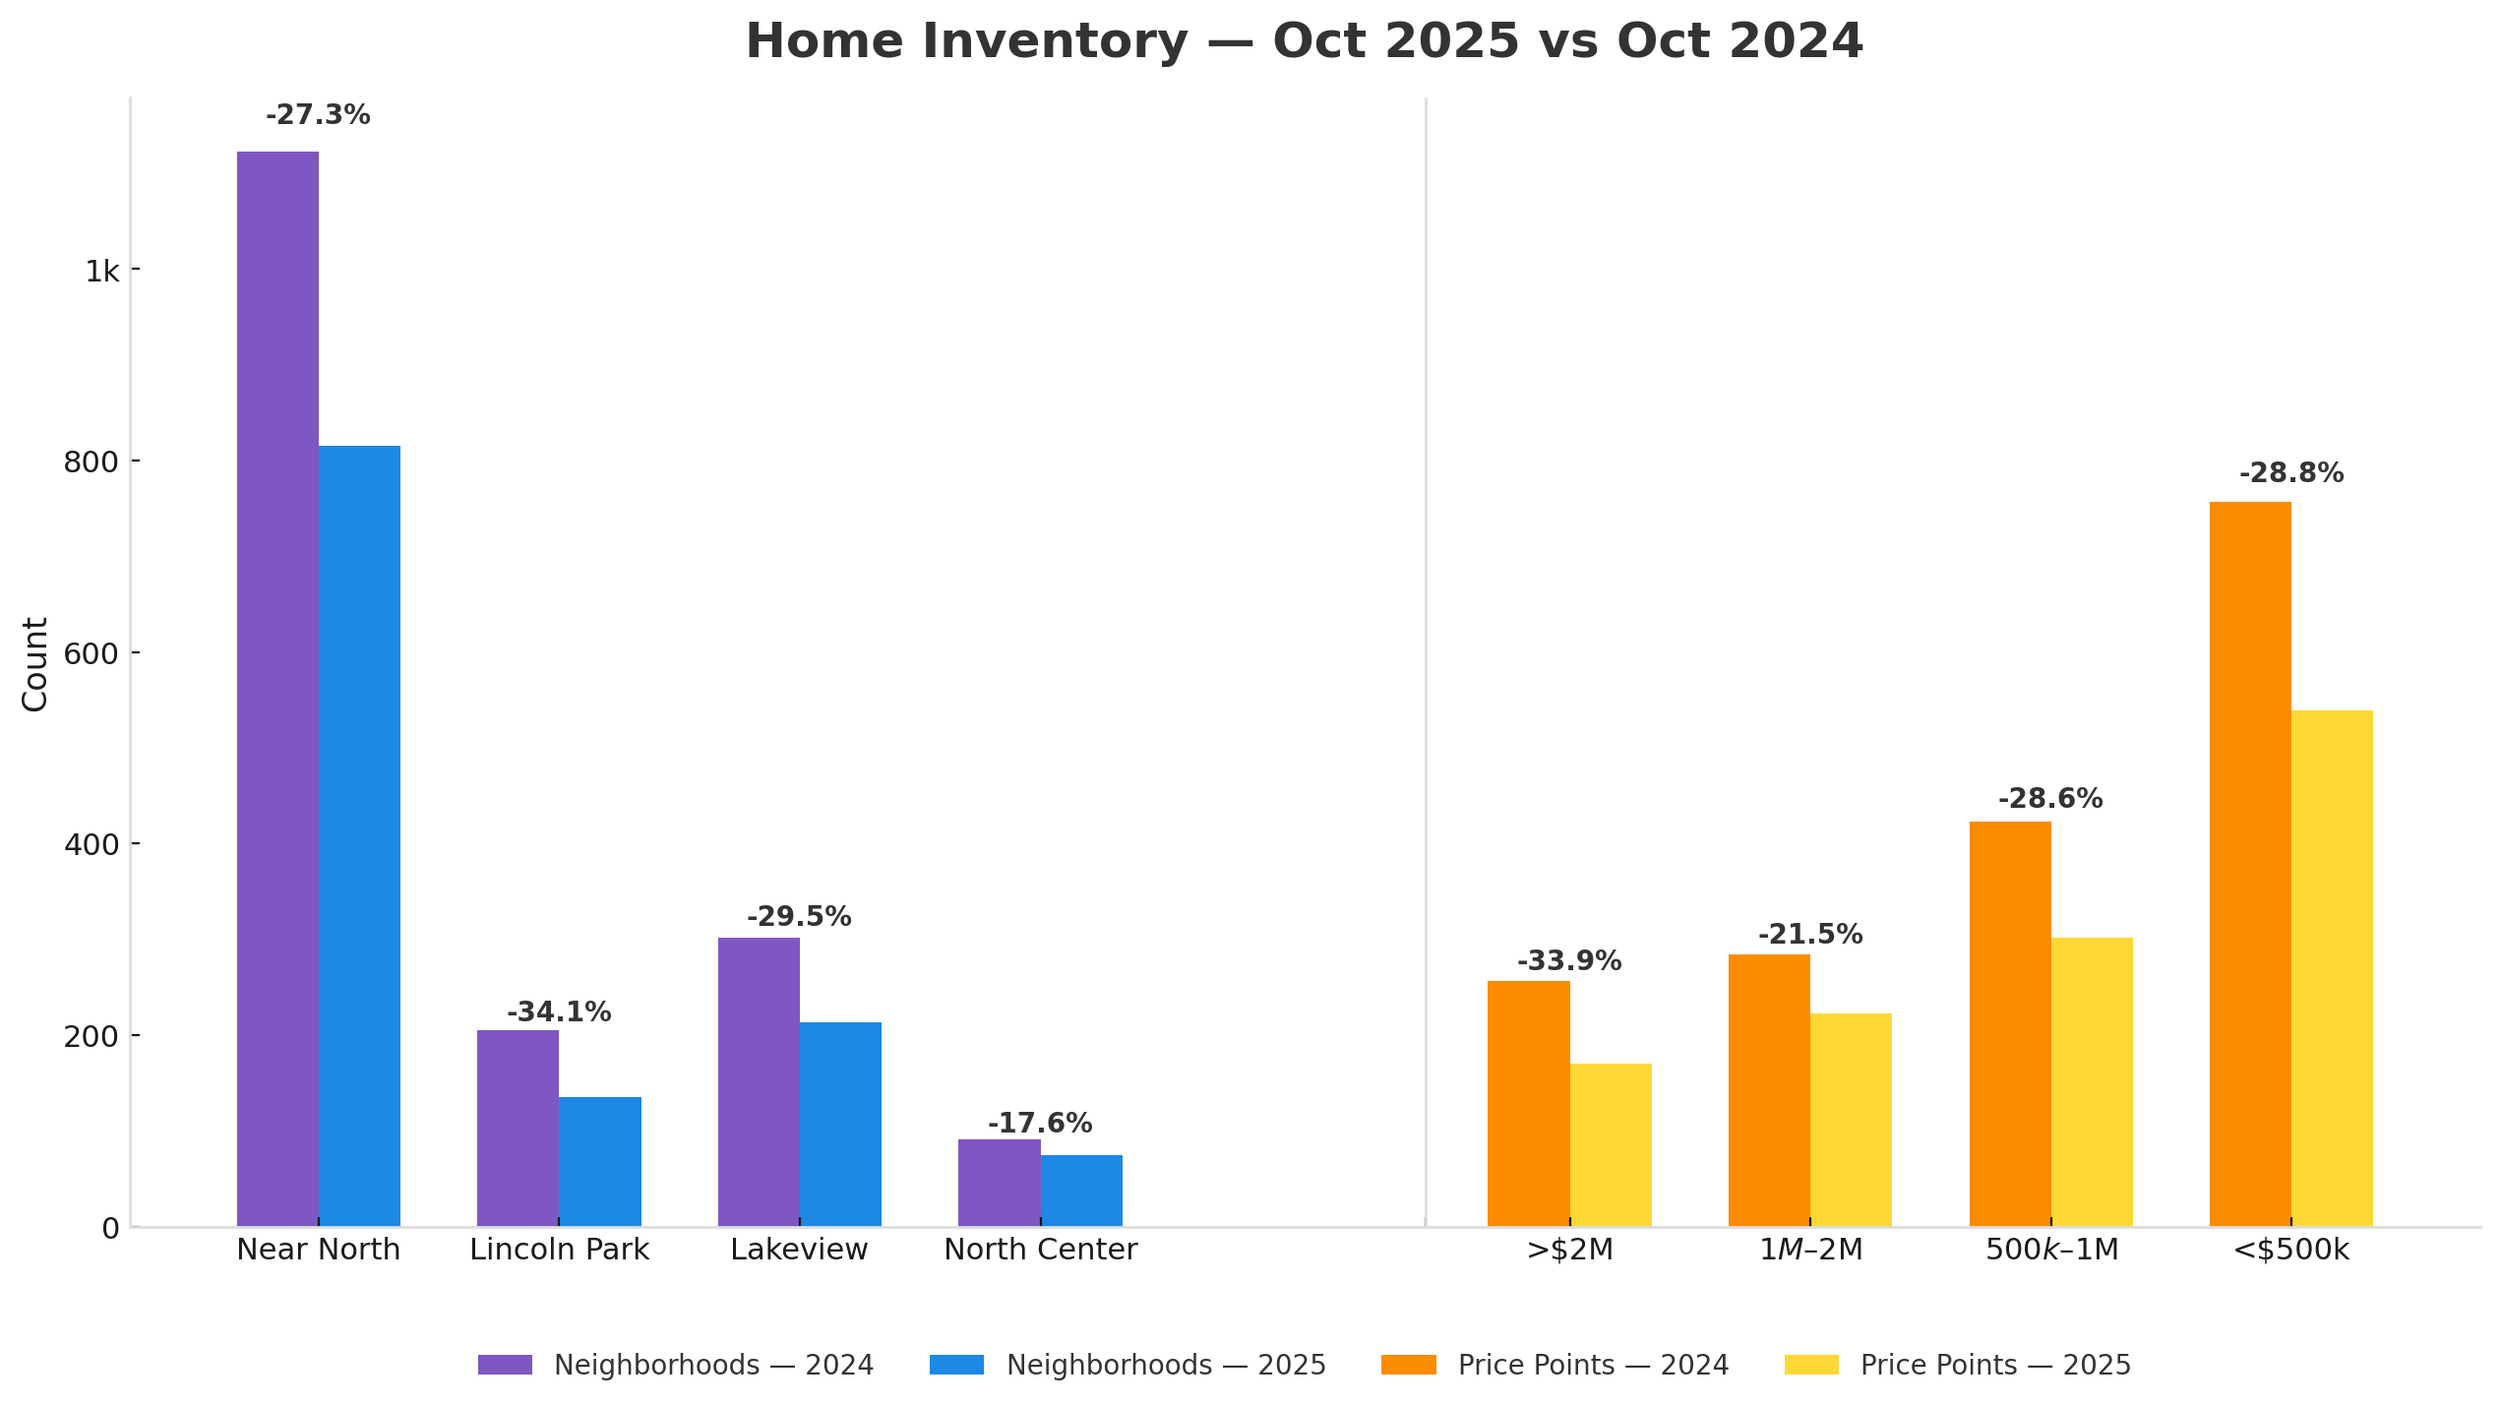
Noteworthy:
Overall supply dropped -28.4% in October 2025, with double digit decreases in all four neighborhoods.
OCTOBER MONTHS OF SUPPLY OF INVENTORY
Year To Date 2025 vs 2024 - Down 21.4% to 2.2 MSI
October 2025 vs 2024 - Down 28.6% to 2.0 MSI

Noteworthy :
October 2025 Inventory levels tightened to 2.0 MSI (down -28.4%). Lincoln Park dropped to 1.2 MSI vs 1.9MSI in 2024.
OCTOBER MEDIAN PRICING
Year To Date 2025 vs 2024 - Up 8.4%
October 2025 vs 2024 - Up 10.2%
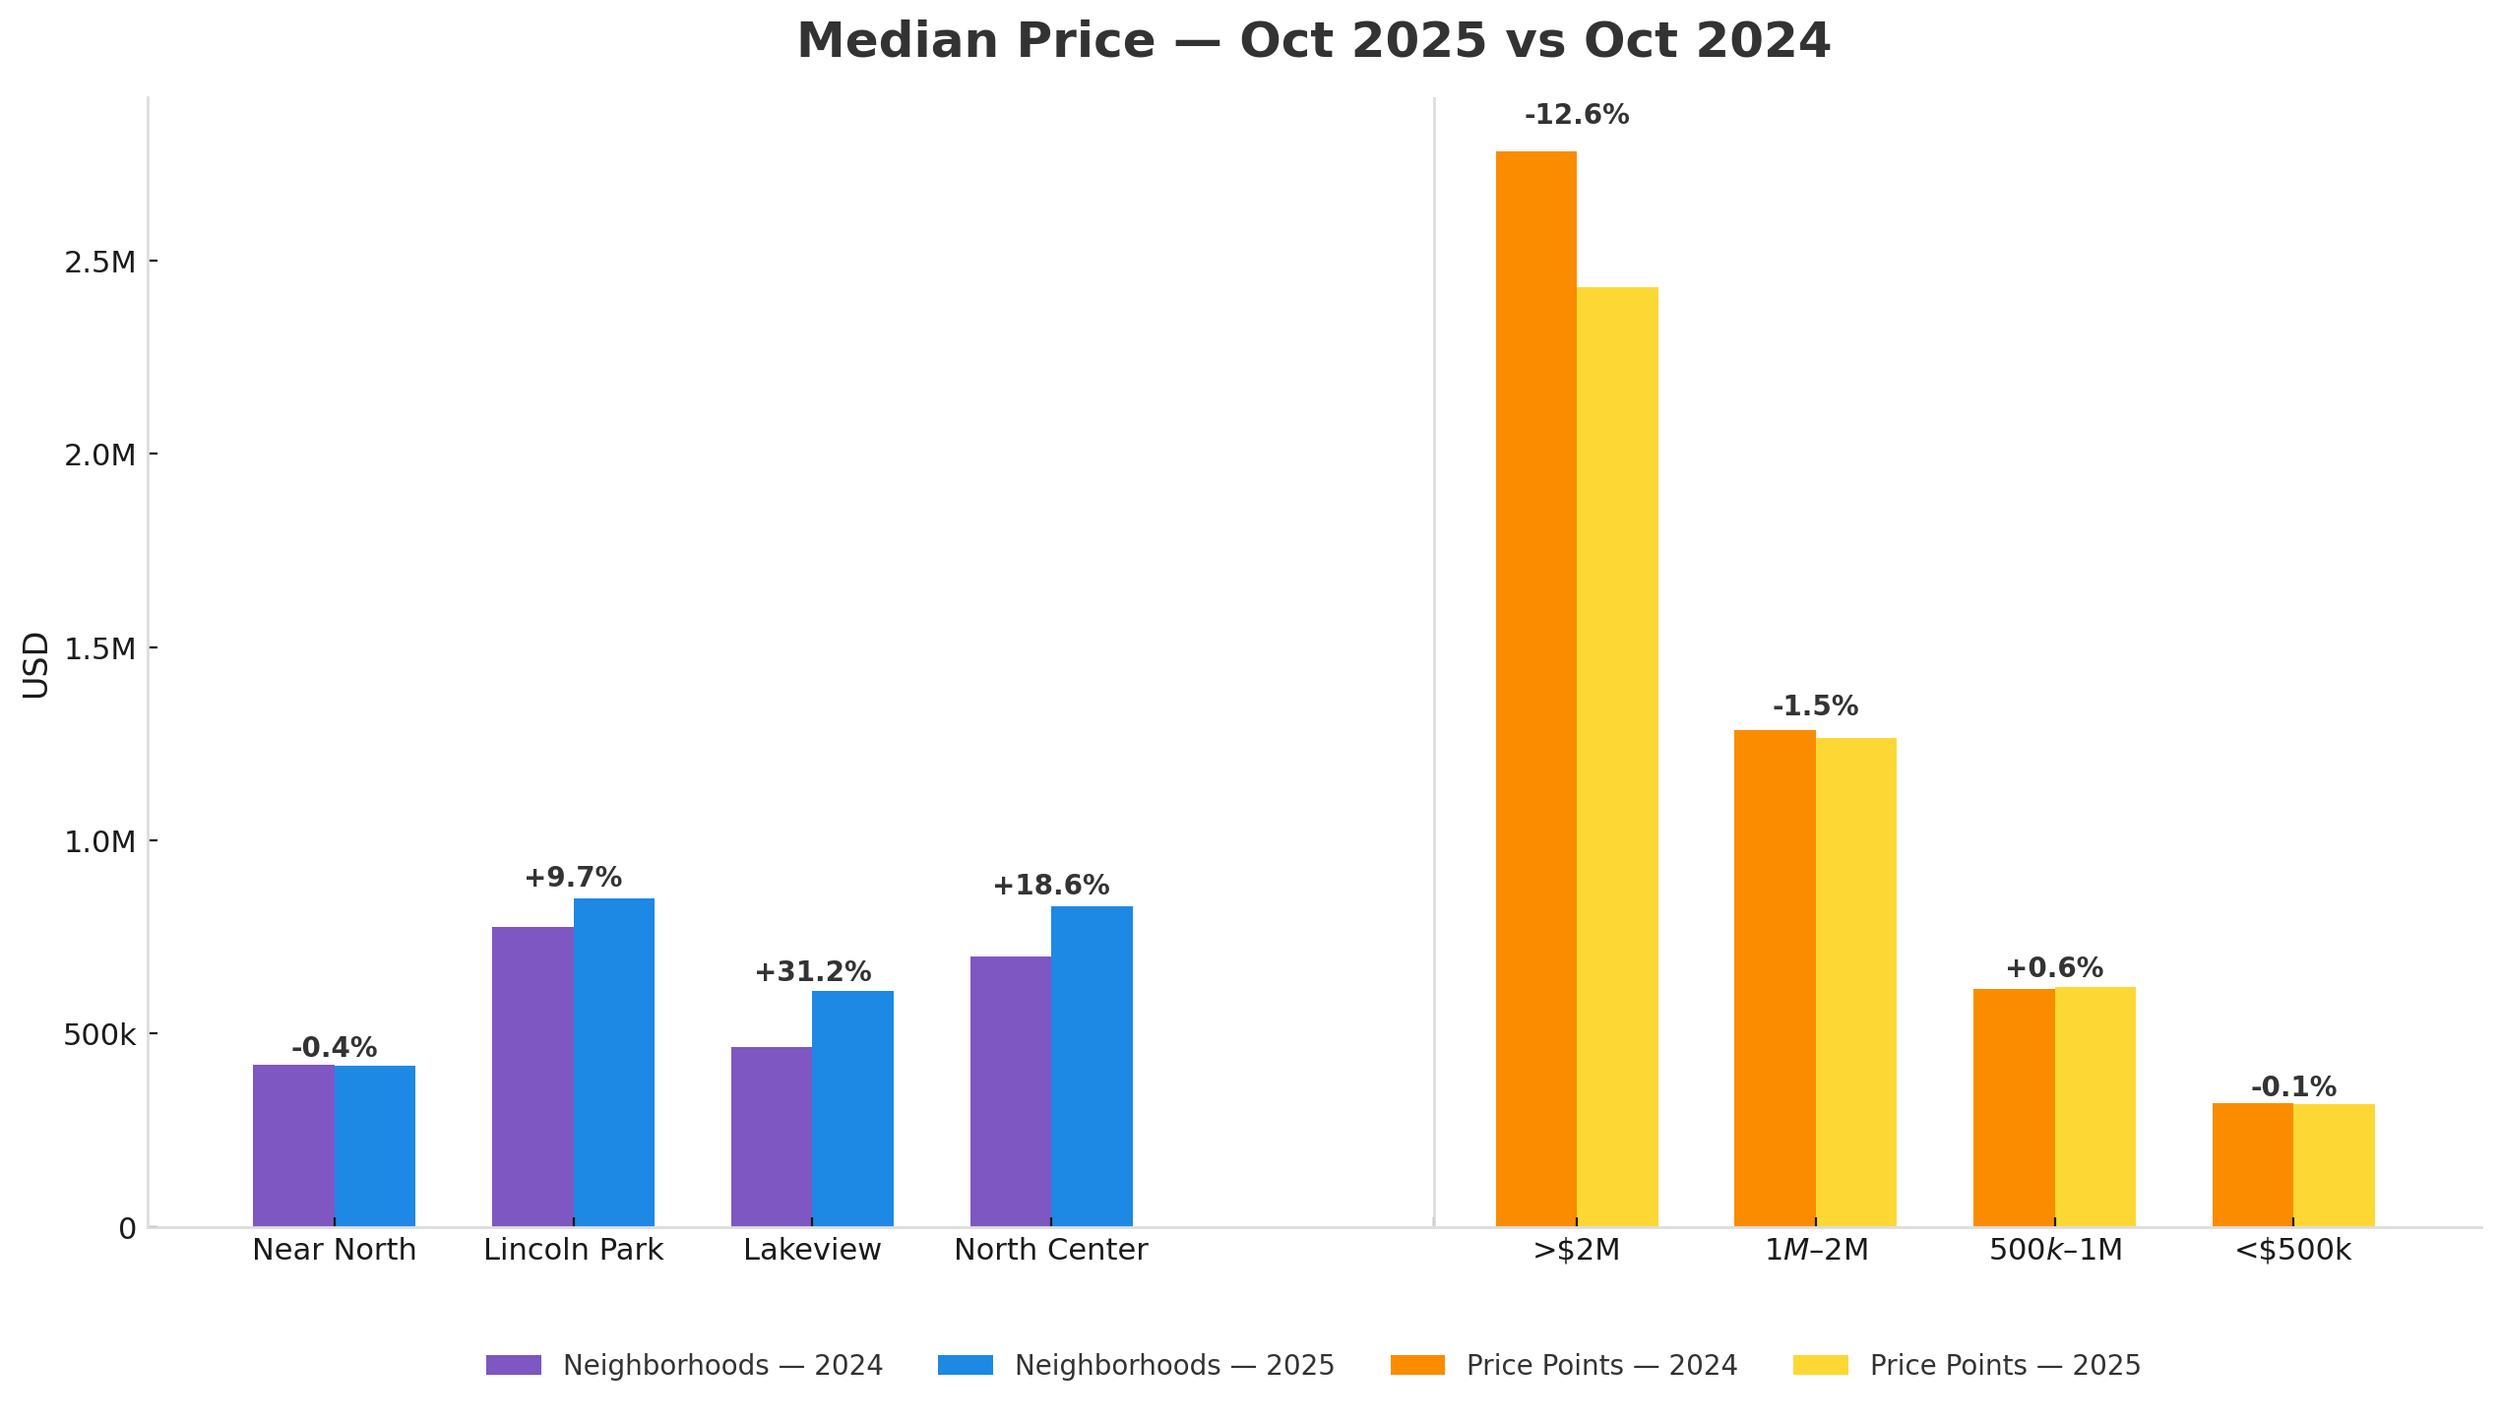
Noteworthy :
Median Prices rose +10.2% overall in October 2025 vs 2024. Lakeview posted the strongest gain (+31.2%), while Near North prices dropped slightly (-0.4%)
OCTOBER NEW LISTINGS
Year To Date 2025 vs 2024- Down 11.3%
October 2025 vs 2024 - Down 15.1%

Noteworthy :
October 2025 New Listings were down -15.1% overall (752 vs 886).
OCTOBER SUMMARY
OCTOBER MARKET INDICATORS
Despite historically low inventory levels and rising home prices, combined home sales rose modestly in October 2025 vs 2024 in our subject neighborhoods (+2.8%) and in homes priced over $500,000.
This is the second consecutive month of home sales increases in what should be a down market.
Active open house turnouts, increased offer incentives and multiple offers are testament that buyers are out there; however, there are just not enough homes for sale. The good news is that lower interest rates are giving potential buyers more buying power in a market of rising prices.
Lincoln Park seems to be having the most difficult time and posted home sales decreases for the third consecutive month. Inventory levels have hit an all time low with a total of 135 homes for sale in October and an MSI of 1.2. Lincoln Park continues to be one of the most desirable neighborhoods in Chicago; however, it is an example of what happens when inventory levels sink so low that they can no longer sustain last years sales, despite a significant amount of potential buyers. On the bright side for Lincoln Park home owners, home prices rose 12.0% in October 2025 vs 2024.
Be sure that your broker has experience in navigating this sometimes difficult and complicated market.
GOING FORWARD
With the current turmoil at the national and local levels, events continue to unfold. This makes it impossible to predict with certainty how our local real estate business will be affected. One thing that is certain is that the market needs a major influx of inventory.
YOUR HOME
A logical question would be “how does all of this affect the home that I am planning to sell or potentially buy?”
Every home is unique and a detailed analysis of your property and neighborhood is a necessity to fully understand the true market value and whether this is the right time to buy or sell.
There are many criteria both objective and subjective that must be analyzed in order to get a true picture.
Internet home pricing sites that claim to calculate your home’s value using only algorithms can be wildly inaccurate. Many market analysis from real estate agents that have not taken the time to personally tour the home can also be seriously flawed. Today’s volatility demands that you get a broker who thoroughly understands this rapidly changing market.
Whether you are buying or selling a home, we would welcome the opportunity to have a conversation about your real estate needs, goals and expectations.