
DECEMBER 2025 MARKET ANALYSIS FOR CHICAGO'S NORTH SIDE
Our monthly market analysis details six real estate metrics for the Near North Side, Lincoln Park, Lakeview and North Center, followed by our comprehensive monthly summary. This month we spotlight Lincoln Park inventory issues.
Please let us know if you need information on any of Chicago’s other neighborhoods
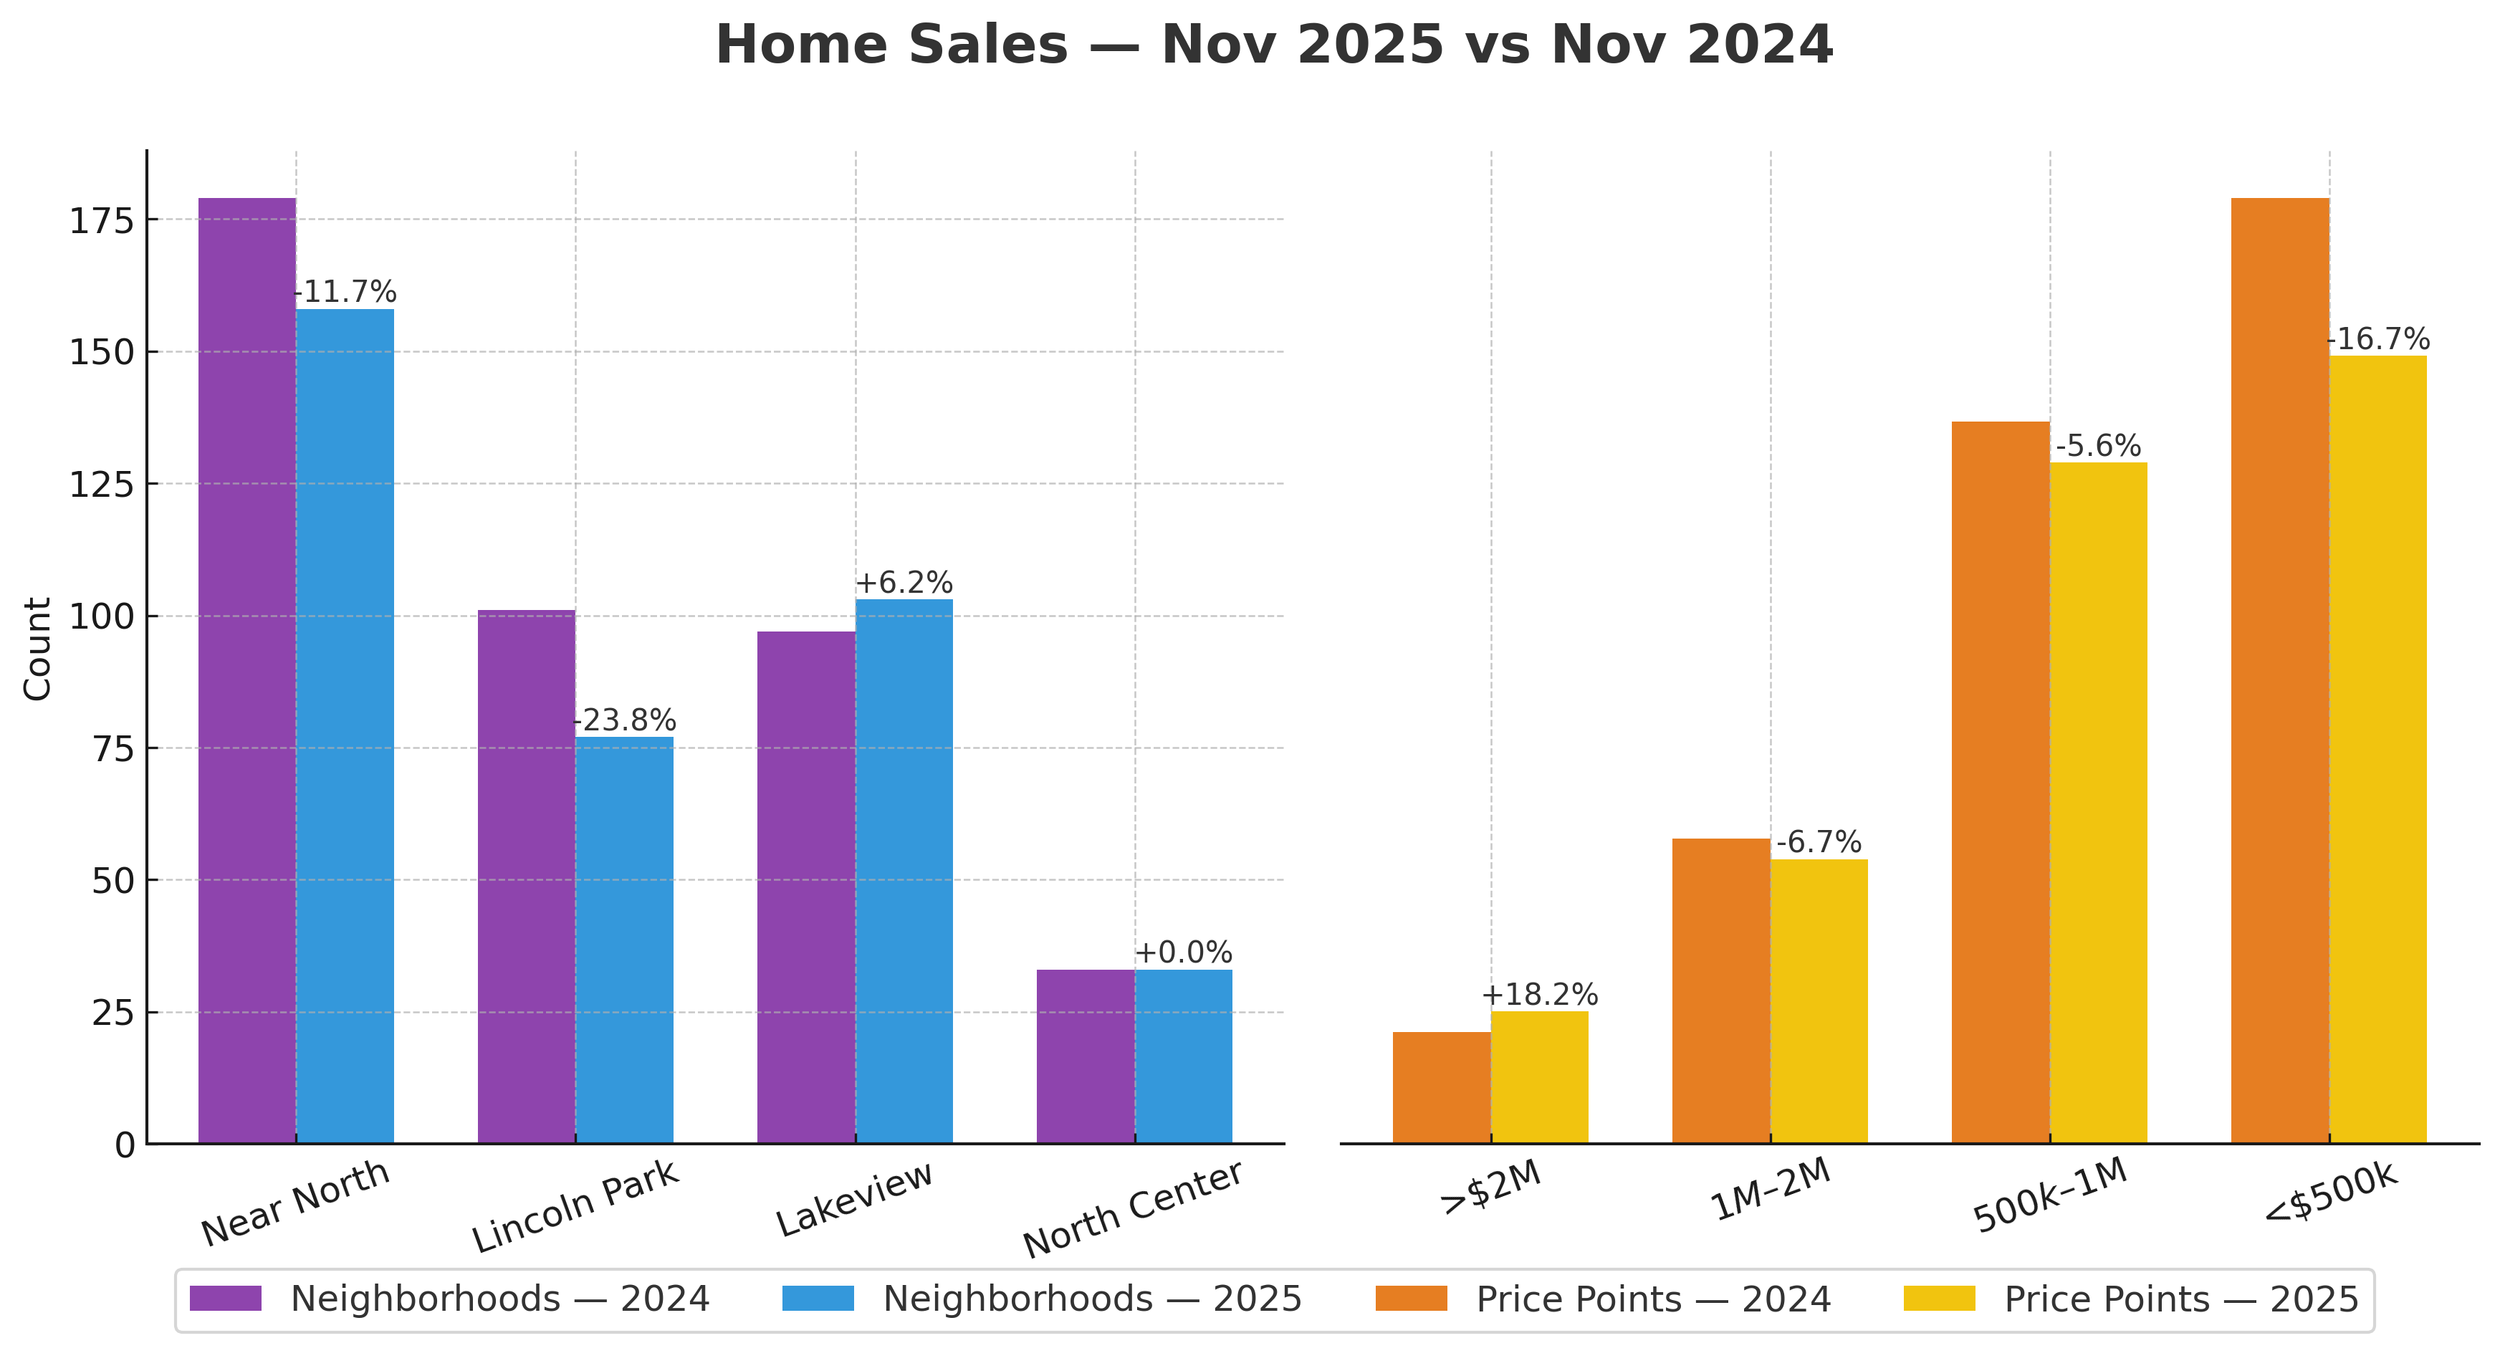
NOVEMBER HOME SALES
Year To Date 2025 vs 2024 - Up 3.3%
November 2025 vs 2024 - Down 9.5%
NOTEWORTHY:
After two previous months of home sales increases, historically low inventory levels drove November 2025 home sales down 9.5% vs 2024.
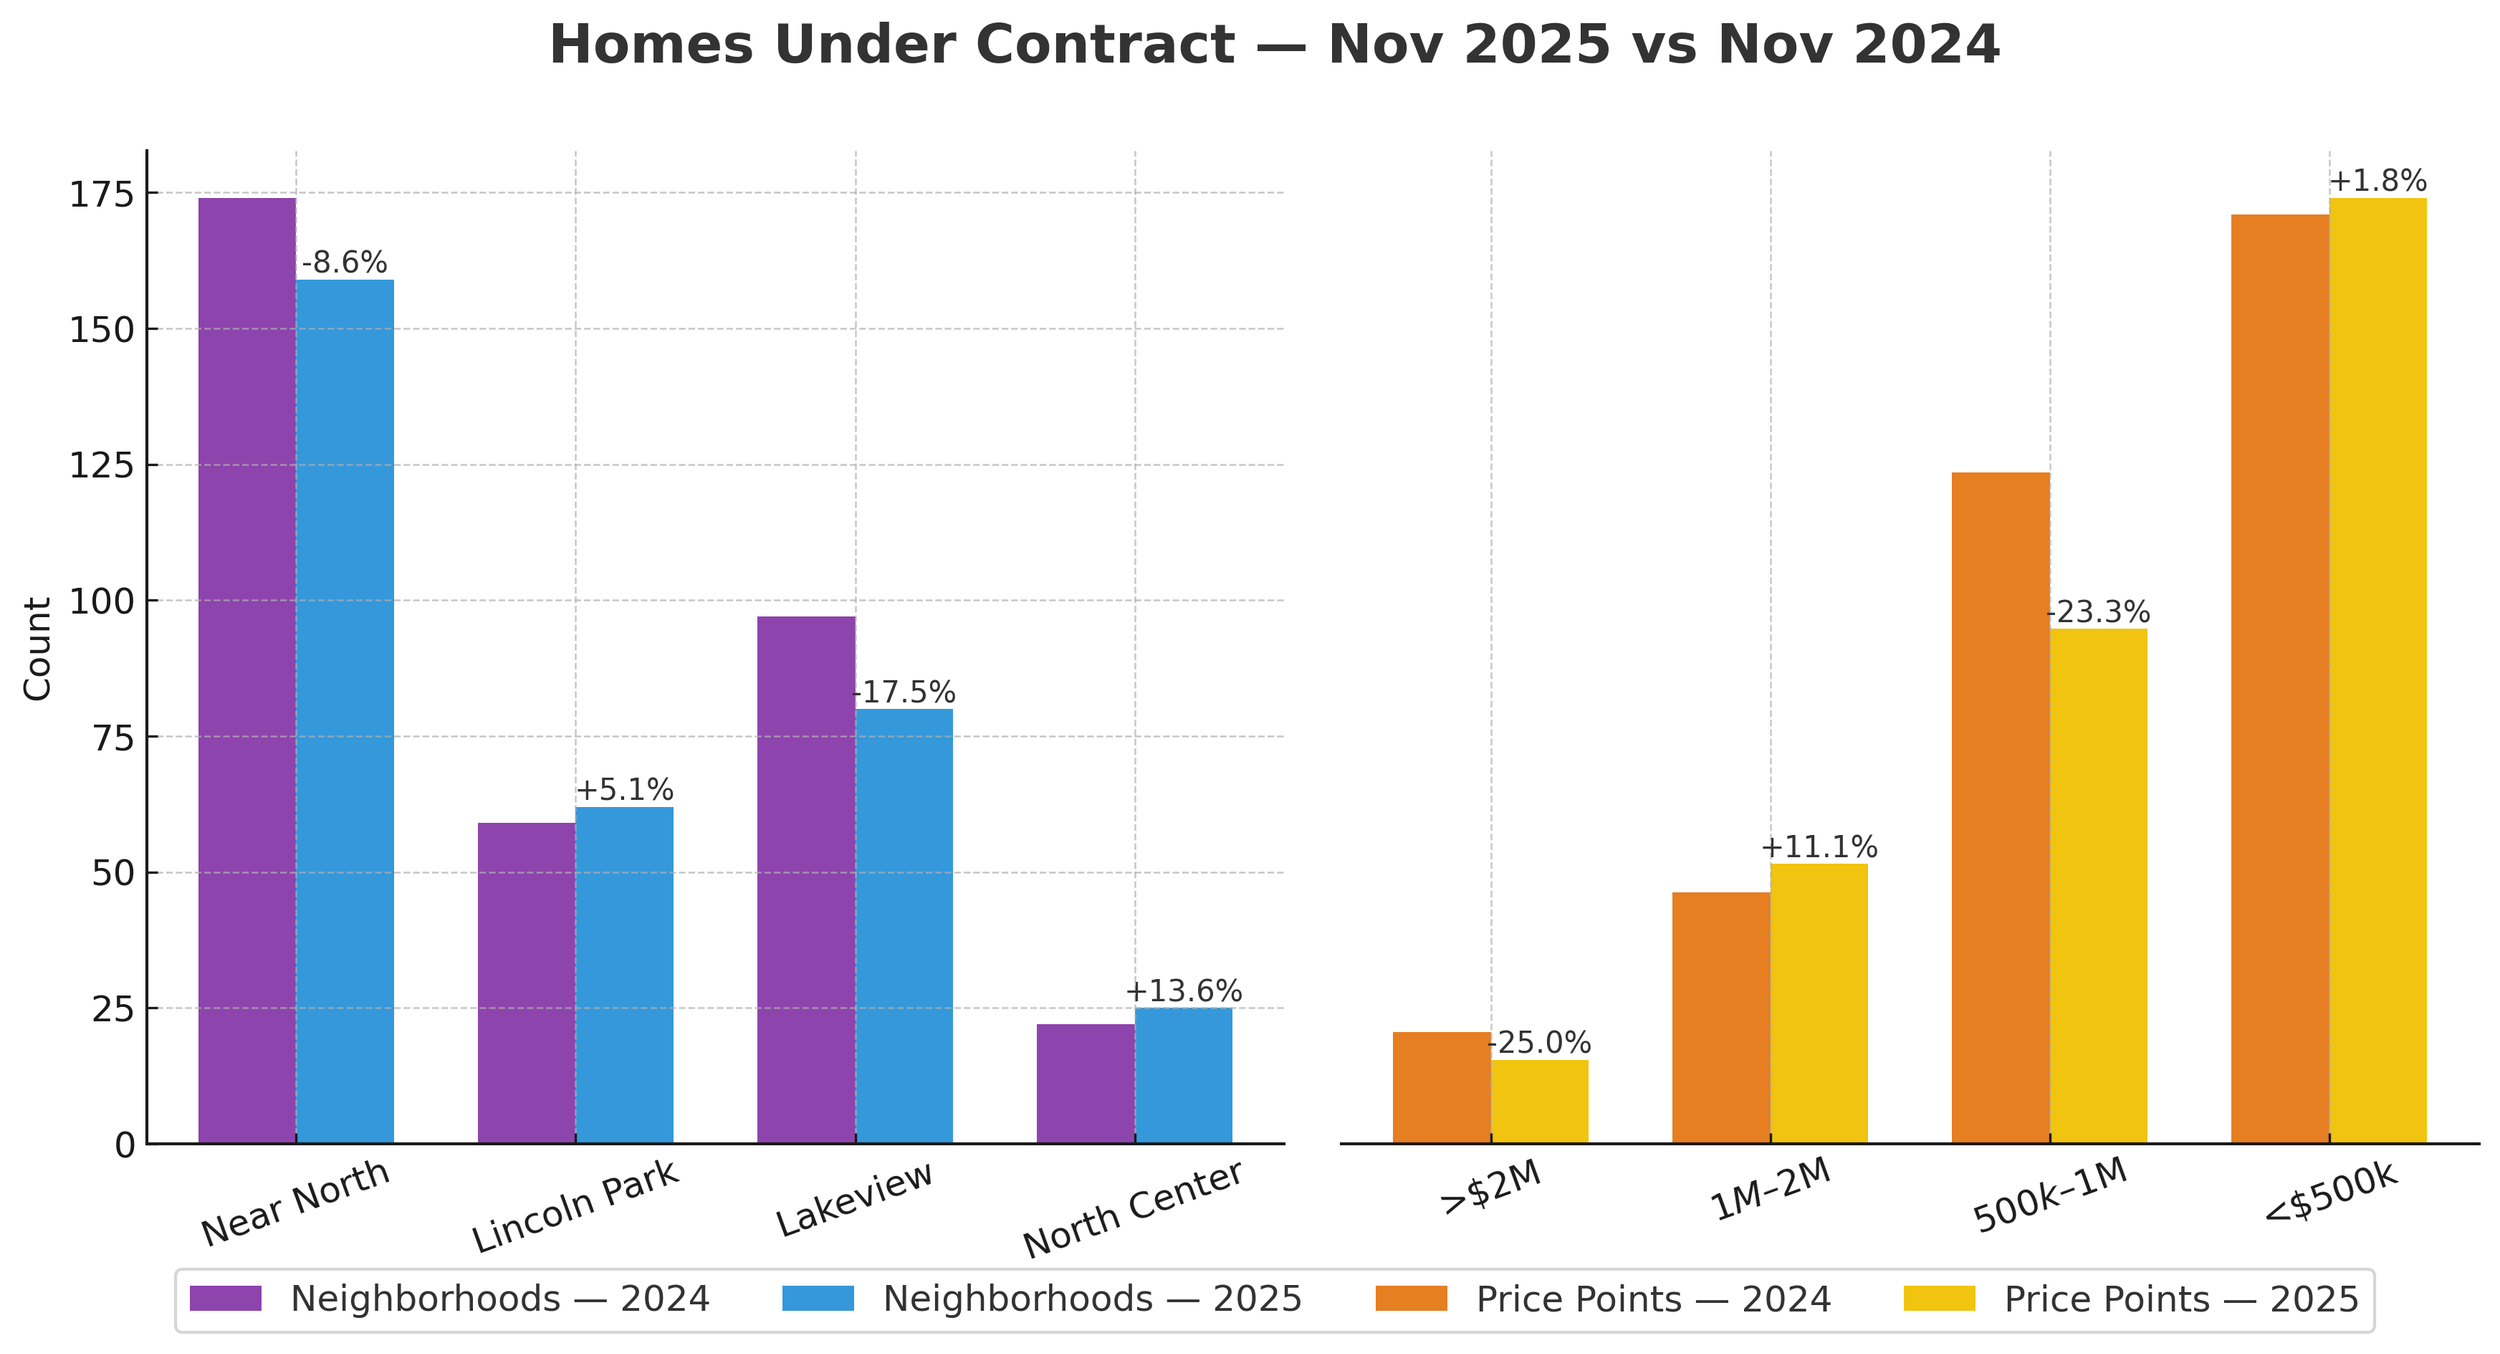
NOVEMBER HOMES UNDER CONTRACT
Year To Date 2025 vs 2024 - Up 2.2%
November 2025 vs 2024 - Down 7.3%
Noteworthy :
Most home sales that closed this month went under contract in a previous month. Units Under Contract reflects a more accurate picture of the current month, although not every home that goes under contract closes. The November 2025 7.3 % decrease from 2024 could be an indicator for December home sales.
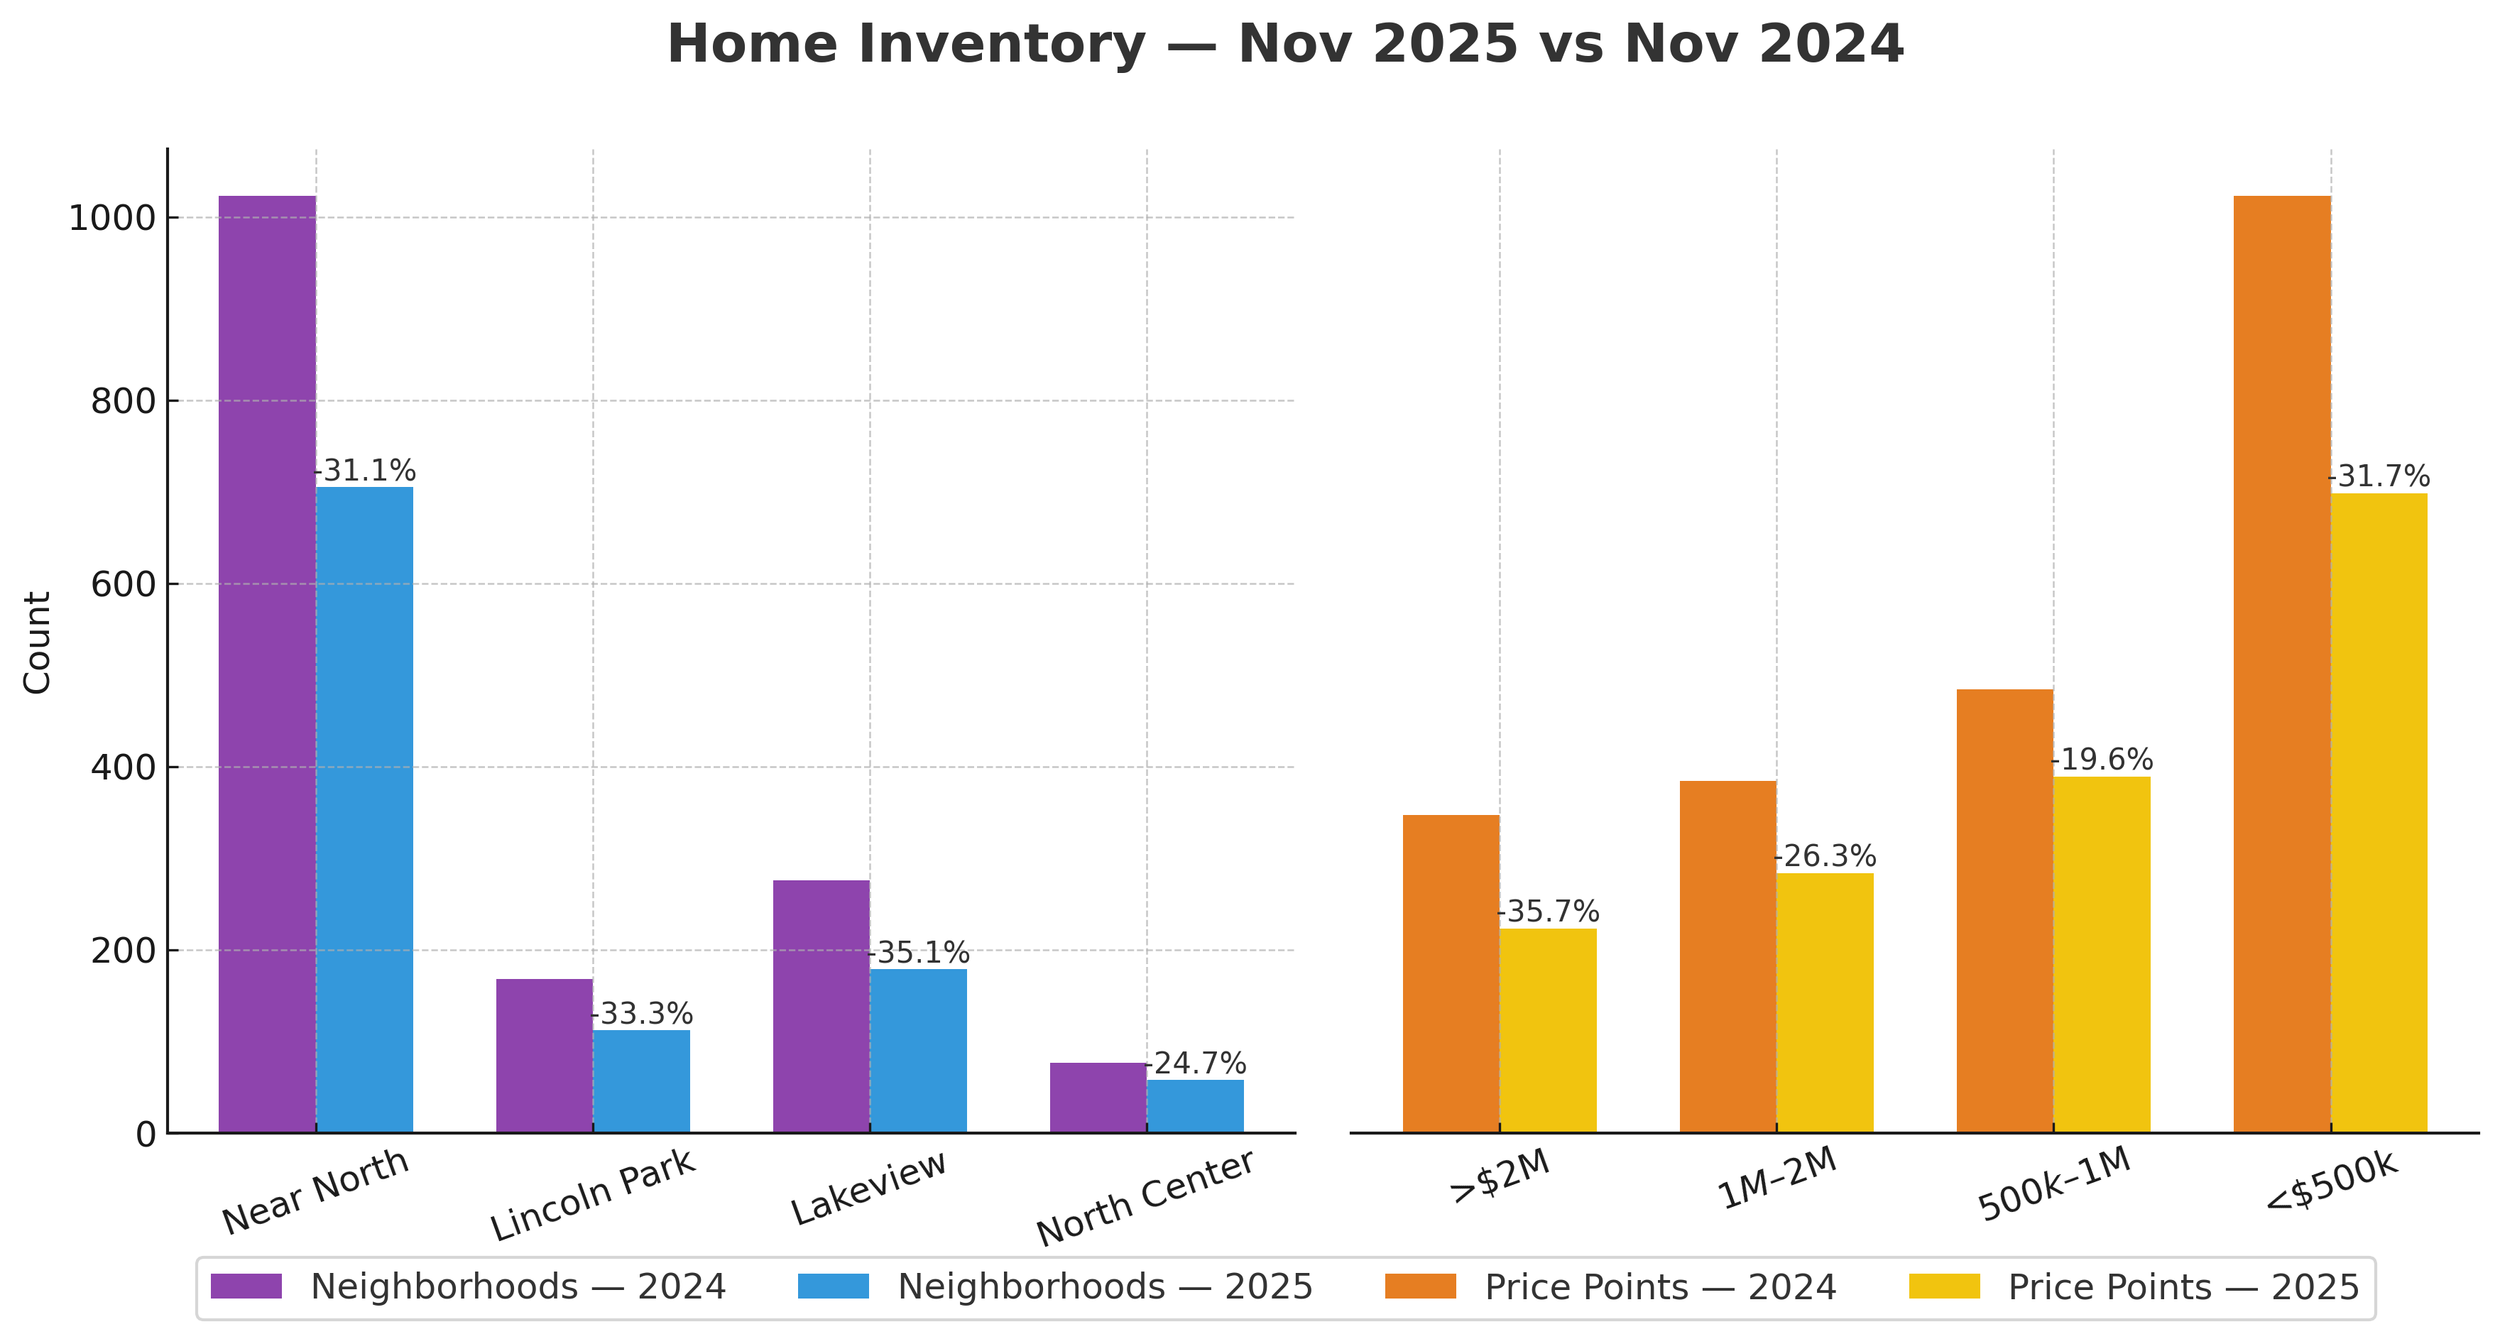
NOVEMBER HOMES FOR SALE
Year To Date 2025 vs 2024 - Down 21.1%
November 2025 vs 2024 - Down 31.7%
Noteworthy:
Overall supply dropped -31.7% in November 2025, with double digit decreases in all four neighborhoods.
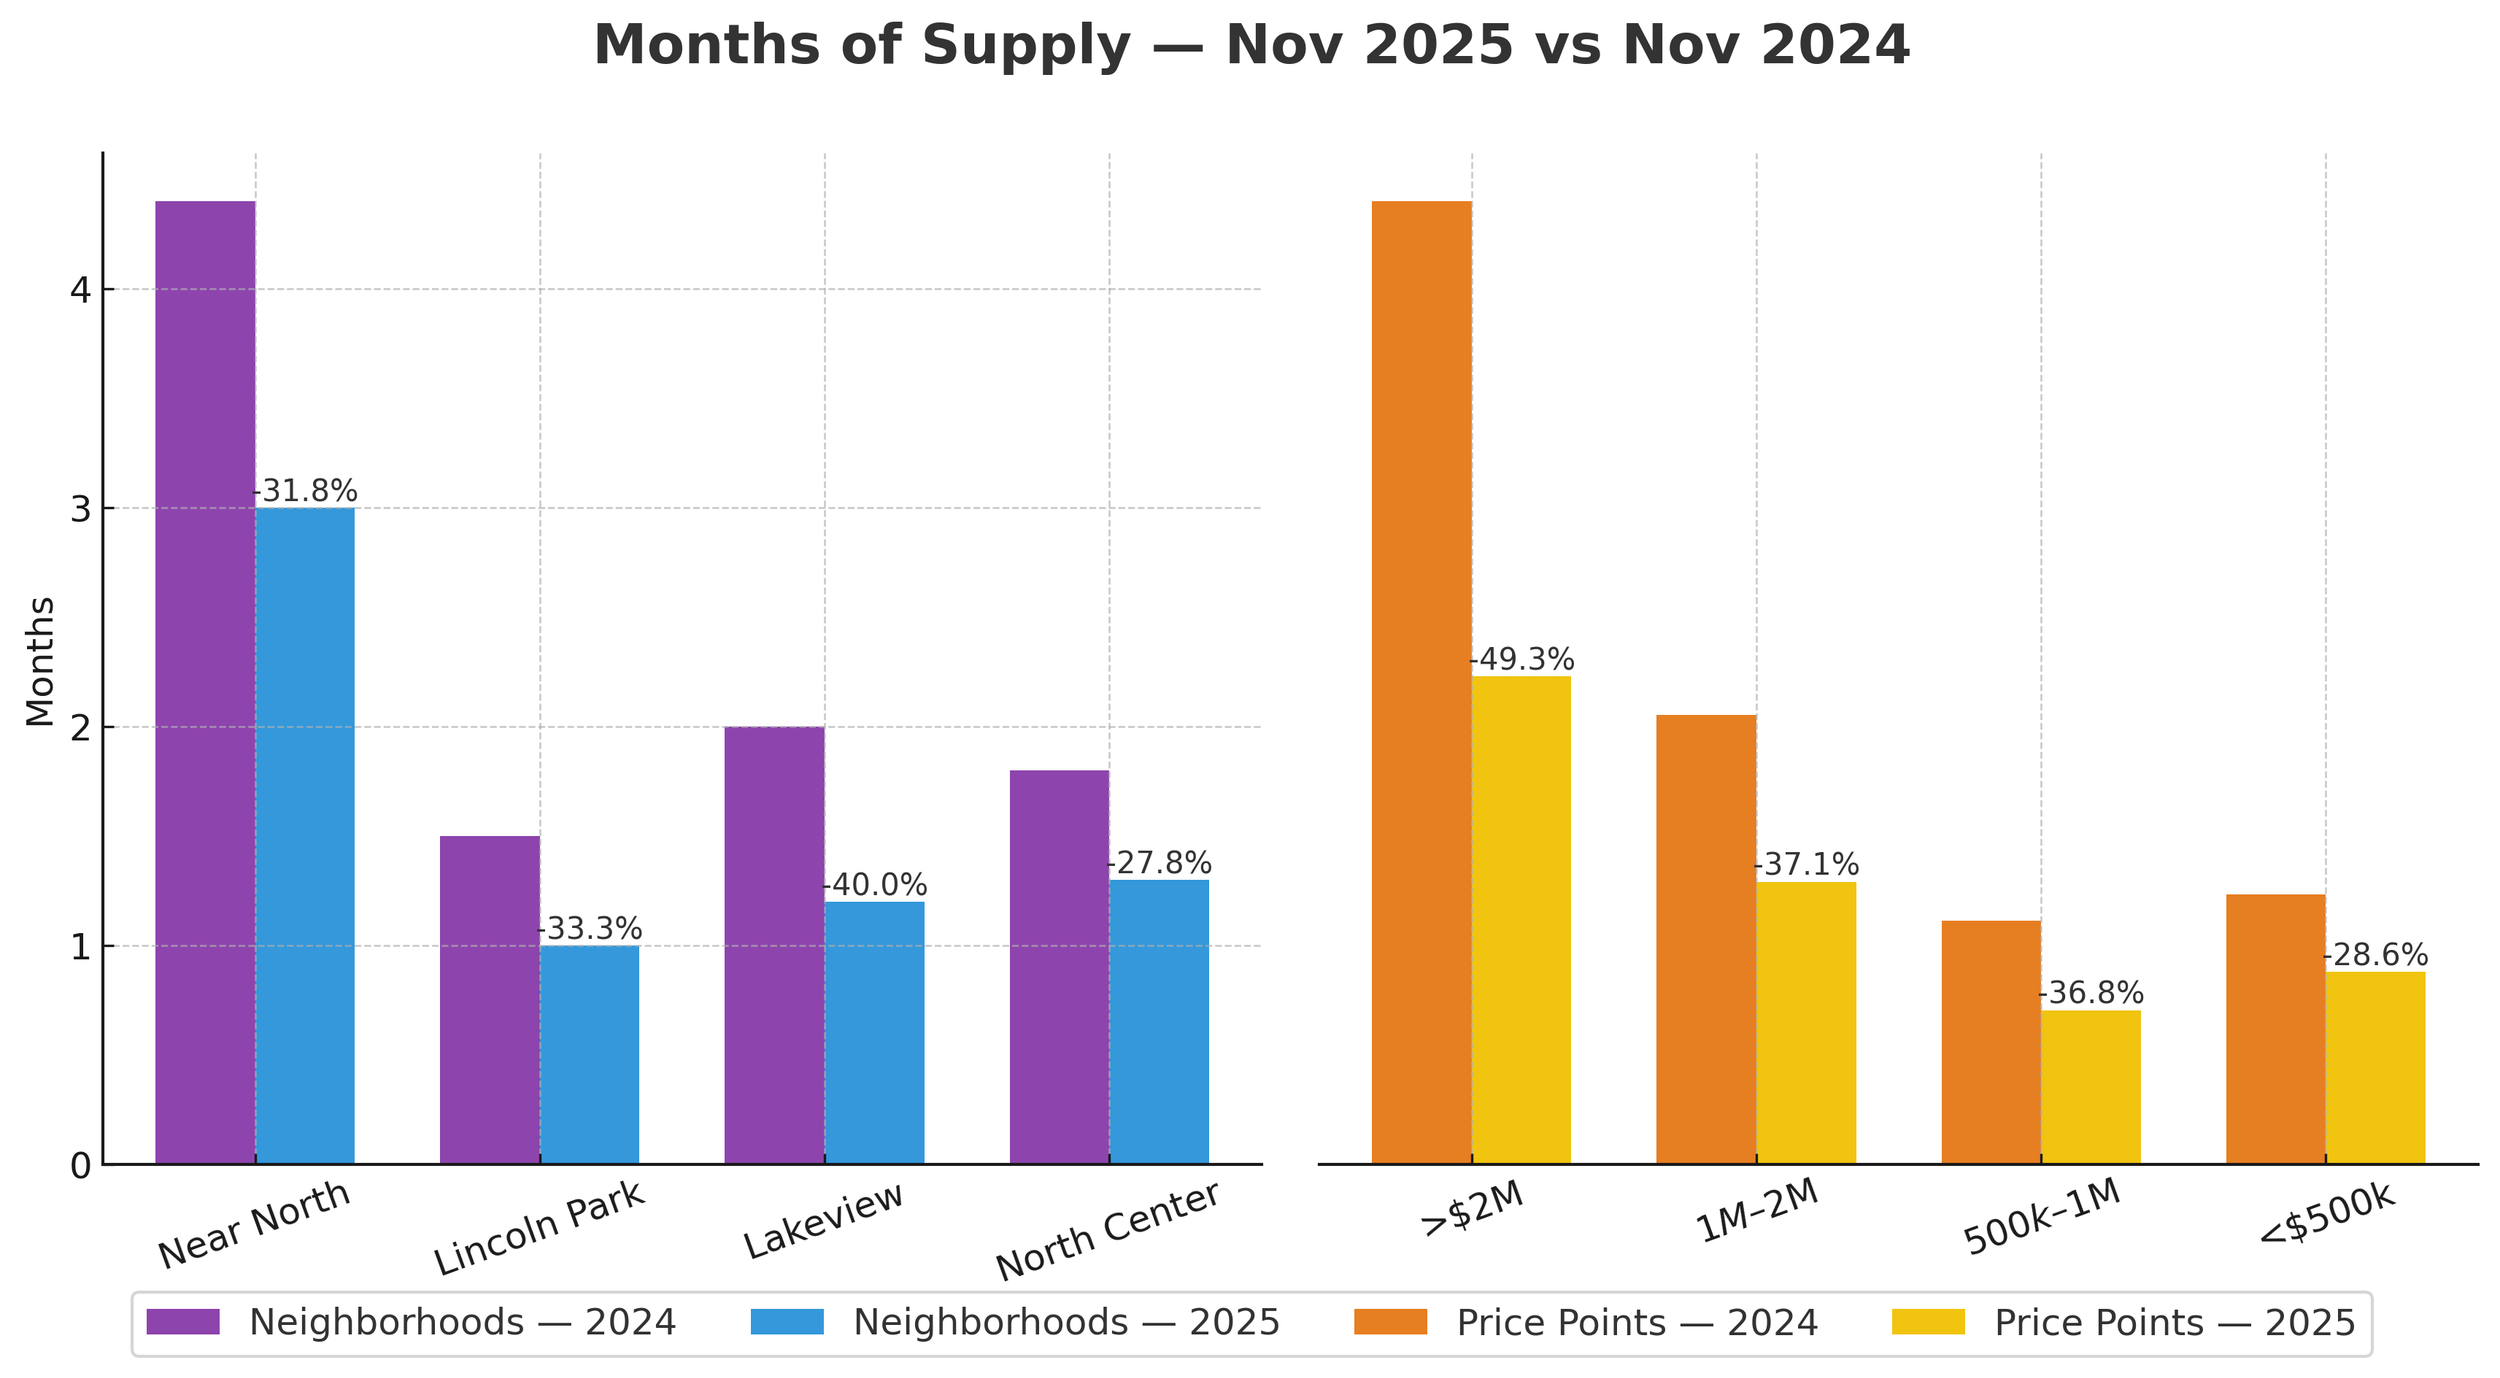
NOVEMBER MONTHS OF SUPPLY OF INVENTORY
Year To Date 2025 vs 2024 - Down 25.0% to 2.1 MSI
November 2025 vs 2024 - Down 33.3% to 1.6 MSI
Noteworthy :
November 2025 Inventory levels tightened to 1.6 MSI (down -33.3%). Lincoln Park dropped to 1.0 MSI vs 1.5 MSI in 2024.
NOVEMBER MEDIAN PRICING
Year To Date 2025 vs 2024 - Up 9.2%
November 2025 vs 2024 - Up 14.8%

Noteworthy :
Median Prices rose +14.8% overall in November 2025 vs 2024. Lincoln Park posted the strongest gain (+25.9%), while Near North prices dropped slightly (-1.6%)
NOVEMBER NEW LISTINGS
Year To Date 2025 vs 2024- Down 11.4%
November 2025 vs 2024 - Down 25.0%
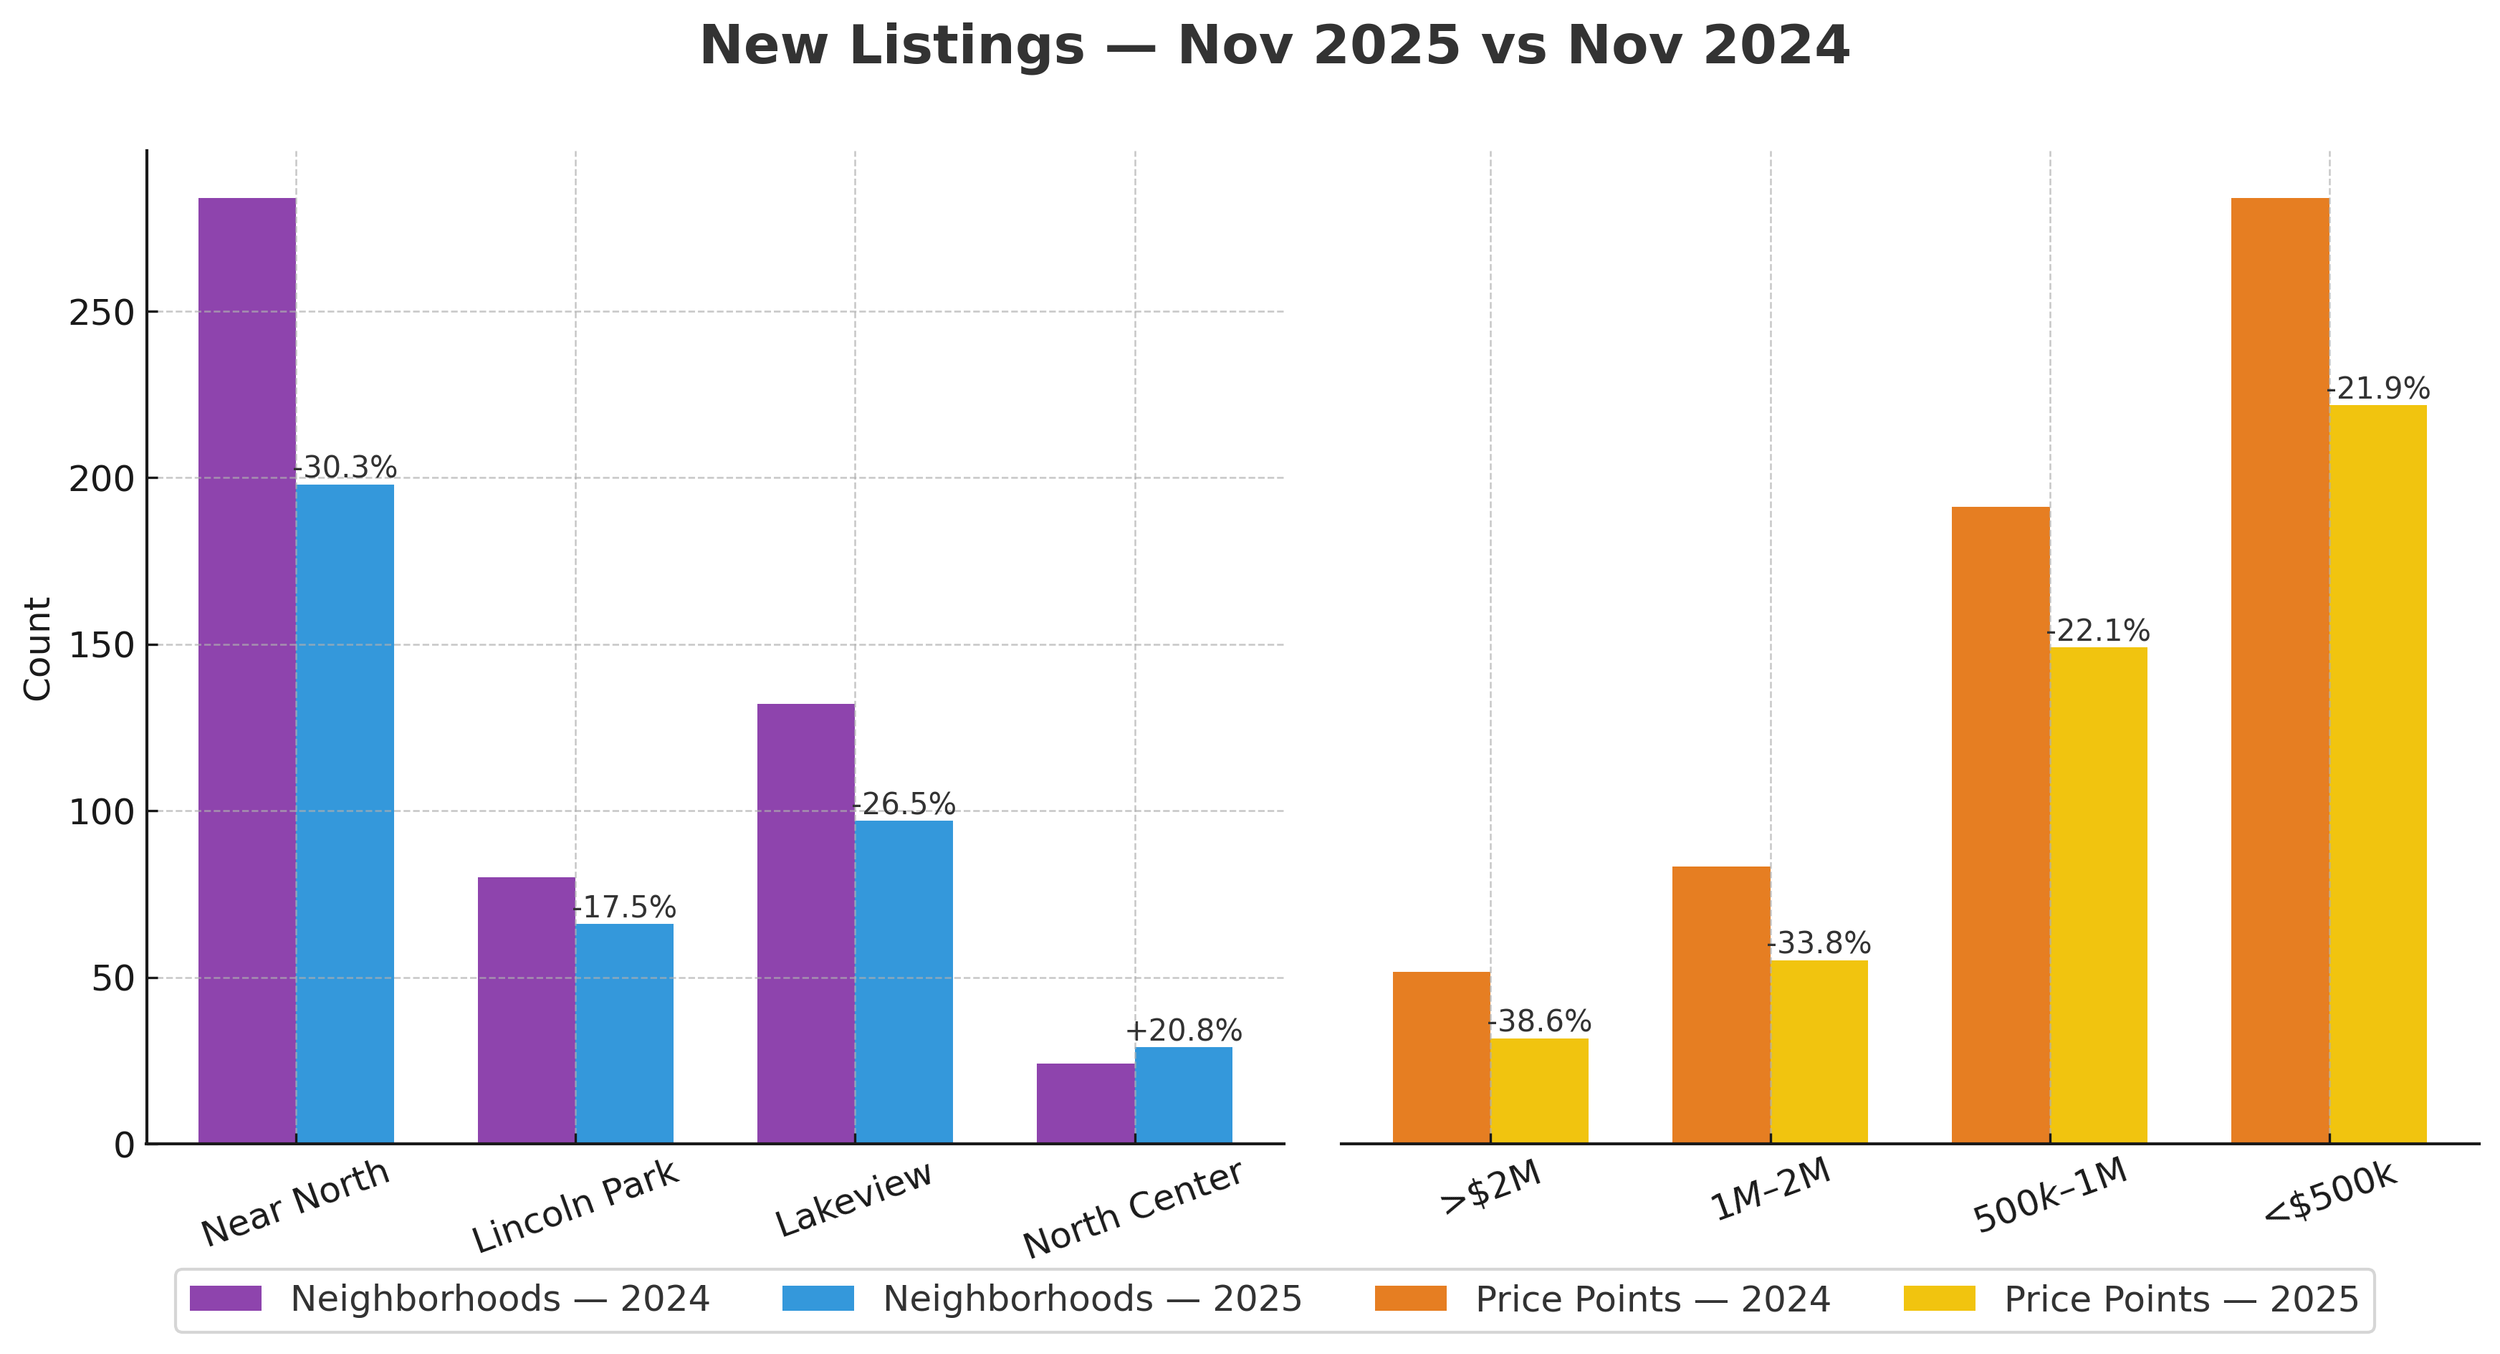
Noteworthy :
November 2025 New Listings were down -25.0% overall (390 vs 520).
NOVEMBER SUMMARY
NOVEMBER MARKET INDICATORS
After two consecutive months of home sales increases, November 2025 dropped 9.5% vs 2024 in the combined neighborhoods of Near North, Lincoln Park, Lakeview and North Center.
While there are a number of factors contributing to this decrease the main culprit is historically low inventory levels.
Much of the Chicago real estate industry has been focusing on rising home prices and the active buyers market. The reality of the market is that inventory levels have been rapidly declining for months and we are now seeing some unsettling results.
Using Lincoln Park as an example, November 2025 home sales dropped 23.8% vs 2024, while inventories dropped 33.3% during the same time period.
There were only 112 homes for sale in Lincoln Park in November. Compare that number to the 598 homes that were for sale in November 2019 before COVID.
There were 65 new listings in November 2025 vs 169 in 2019. ( 323 new listings in October 2019).
Lincoln Park traditionally sells 100 to 200+ homes per month and it is easy to see that there is just not enough inventory to make those numbers.
Lincoln Park has 1.0 months of supply of inventory which is the lowest of the four subject neighborhoods, but inventory levels have been experiencing double digit drops throughout the North Side.
On a positive note, we are still experiencing a very active buyers market. If interest rates continue drop buyers will have more buying power and sellers may be more willing to look for new homes increasing inventory levels.
It should be a very interesting Spring 2026 market
Be sure that your broker has experience in navigating this sometimes difficult and complicated market.
GOING FORWARD
With the current turmoil at the national and local levels, events continue to unfold. This makes it impossible to predict with certainty how our local real estate business will be affected. One thing that is certain is that the market needs a major influx of inventory.
YOUR HOME
A logical question would be “how does all of this affect the home that I am planning to sell or potentially buy?”
Every home is unique and a detailed analysis of your property and neighborhood is a necessity to fully understand the true market value and whether this is the right time to buy or sell.
There are many criteria both objective and subjective that must be analyzed in order to get a true picture.
Internet home pricing sites that claim to calculate your home’s value using only algorithms can be wildly inaccurate. Many market analysis from real estate agents that have not taken the time to personally tour the home can also be seriously flawed. Today’s volatility demands that you get a broker who thoroughly understands this rapidly changing market.
Whether you are buying or selling a home, we would welcome the opportunity to have a conversation about your real estate needs, goals and expectations.